This application case is performed by a user with a technical background related to refurbishment actions in residential buildings. S/he works for a social housing company providing affordable dwellings to citizens. The housing stock s/he is managing is located in the oldest part of the city.
This year, the company has allocated a budget of around 60.000 Euros to upgrade the oldest buildings in the company’s building stock. The manager has asked the user to propose a plan including retrofitting actions assuring not only stability and waterproof quality of the buildings, but also actions aimed at reducing the energy costs of the occupants.
This case illustrates how the SEMANCO platform can be used to assess different options for concrete refurbishment actions and to obtain results balancing both energy and monetary
1. Choosing the area and selecting the corresponding Urban Energy Model (UEM).
An Urban Energy Model of a city is chosen.
1. 1. Selecting the city and the UEM
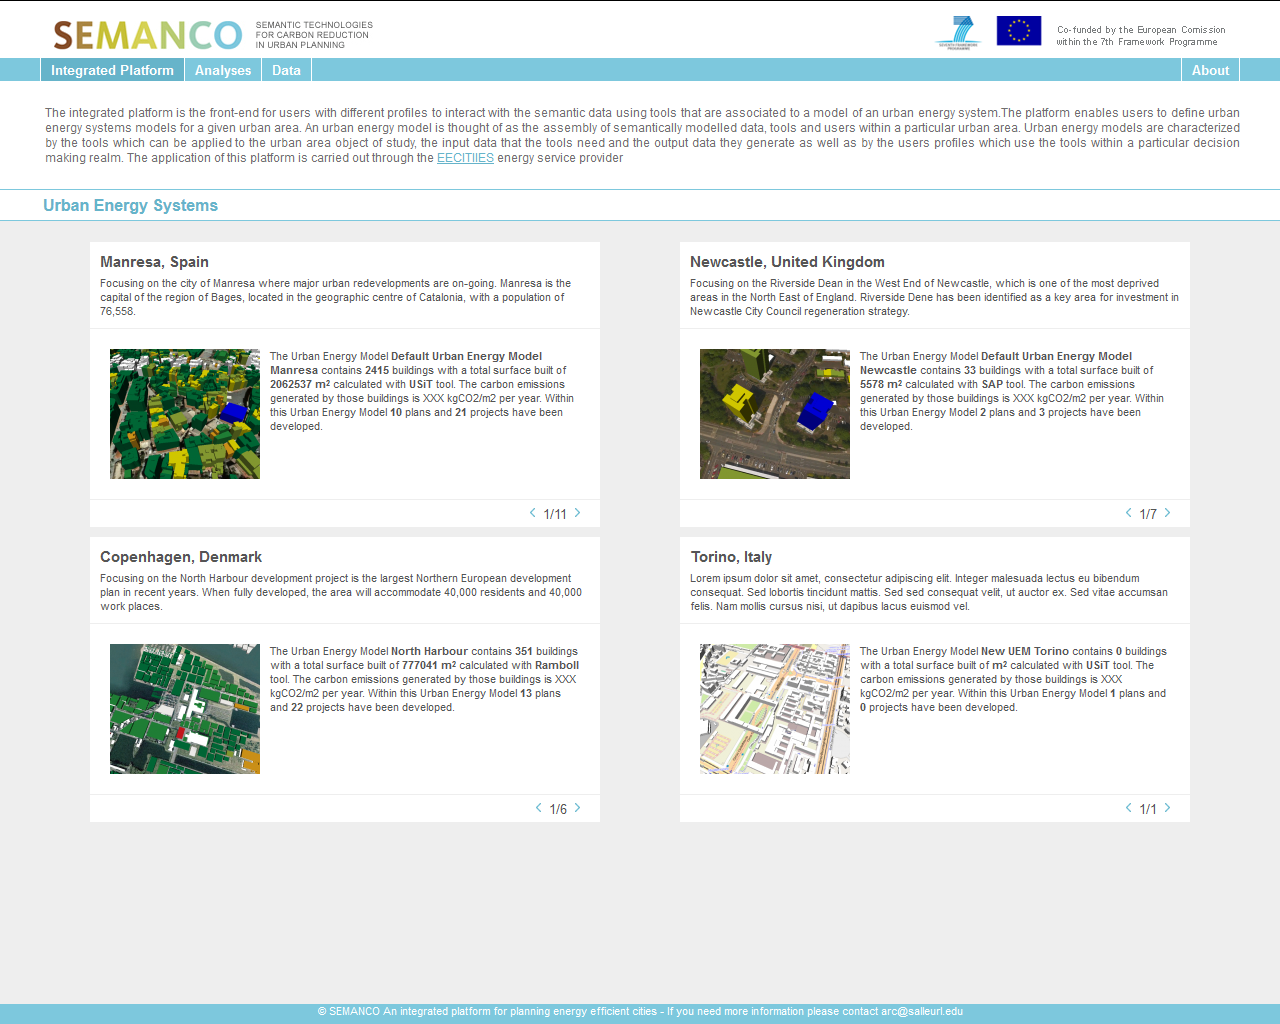
The user selects the corresponding city and the specific Urban Energy Model (UEM) which contains the data and the tools used for the calculation of energy related values. The one selected in this case is based on the URSOS software calculation engine used by the USiT tool. This software adheres to the regulations that apply in the country where the buildings are located, the city of Manresa.
2. Creating a Plan.
A new plan is created and its purpose described.
2.1. Defining the new plan
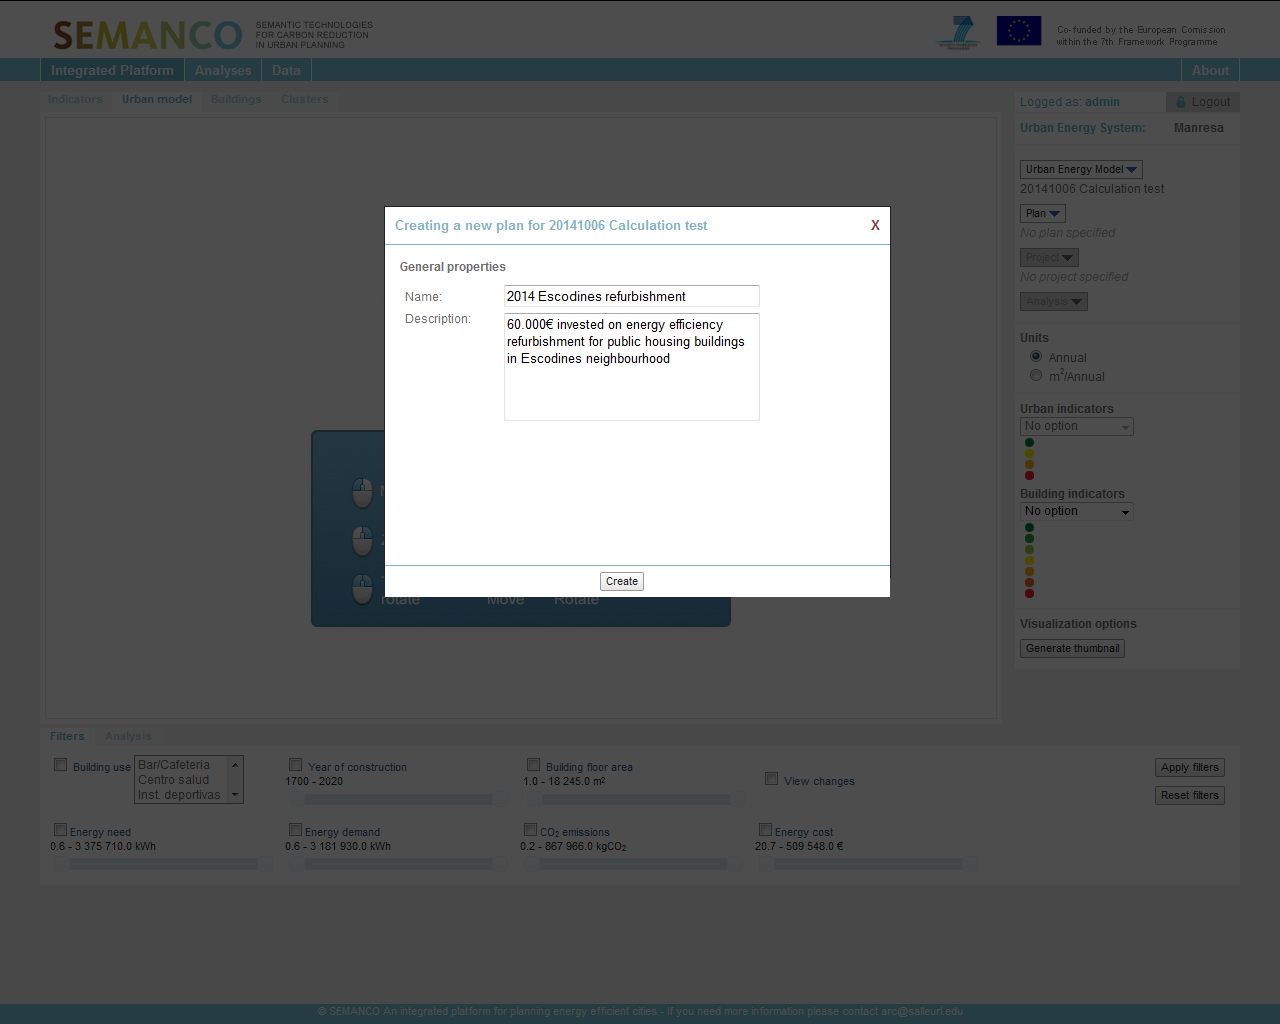
The user creates a new plan and names and describes the plan to differentiate it from other that s/he is currently working on. The name of the plan refers to the area of the city in which the buildings will be located.
3. Searching for the buildings and adding them into the plan.
Buildings to be potentially refurbished are searched and included in the Plan.
3.1 Navigate to the neighbourhood
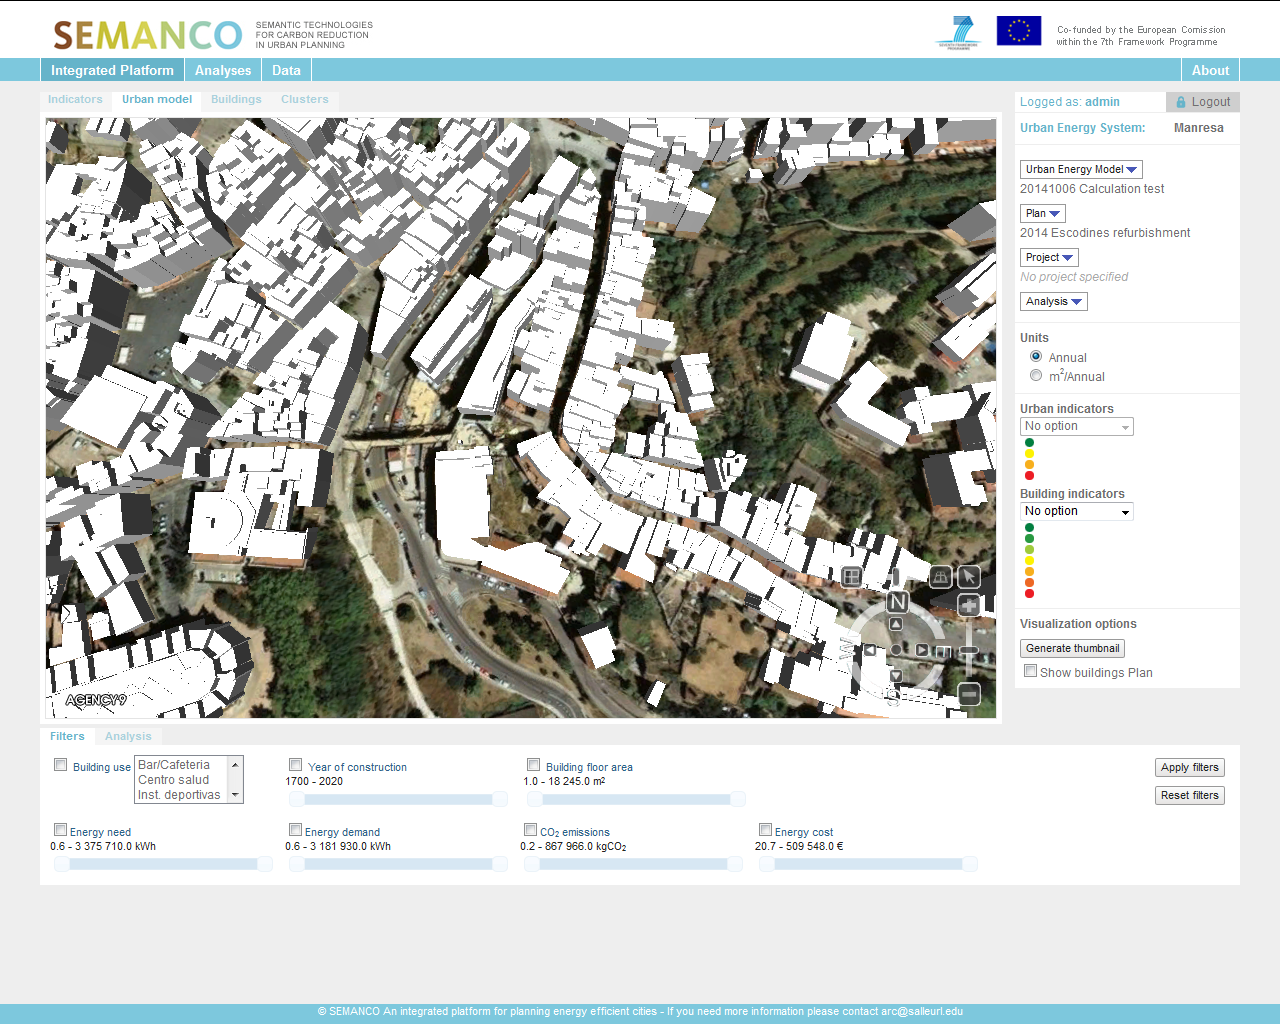
The user navigates until reaching a plan view of the target neighbourhood in which the buildings to be tested are located. Due to its technical profile, the user prefers to apply a two dimensional view, with the north at the top of the screen, to identify quickly all the buildings.
3.2. Filtering buildings according to energy related data
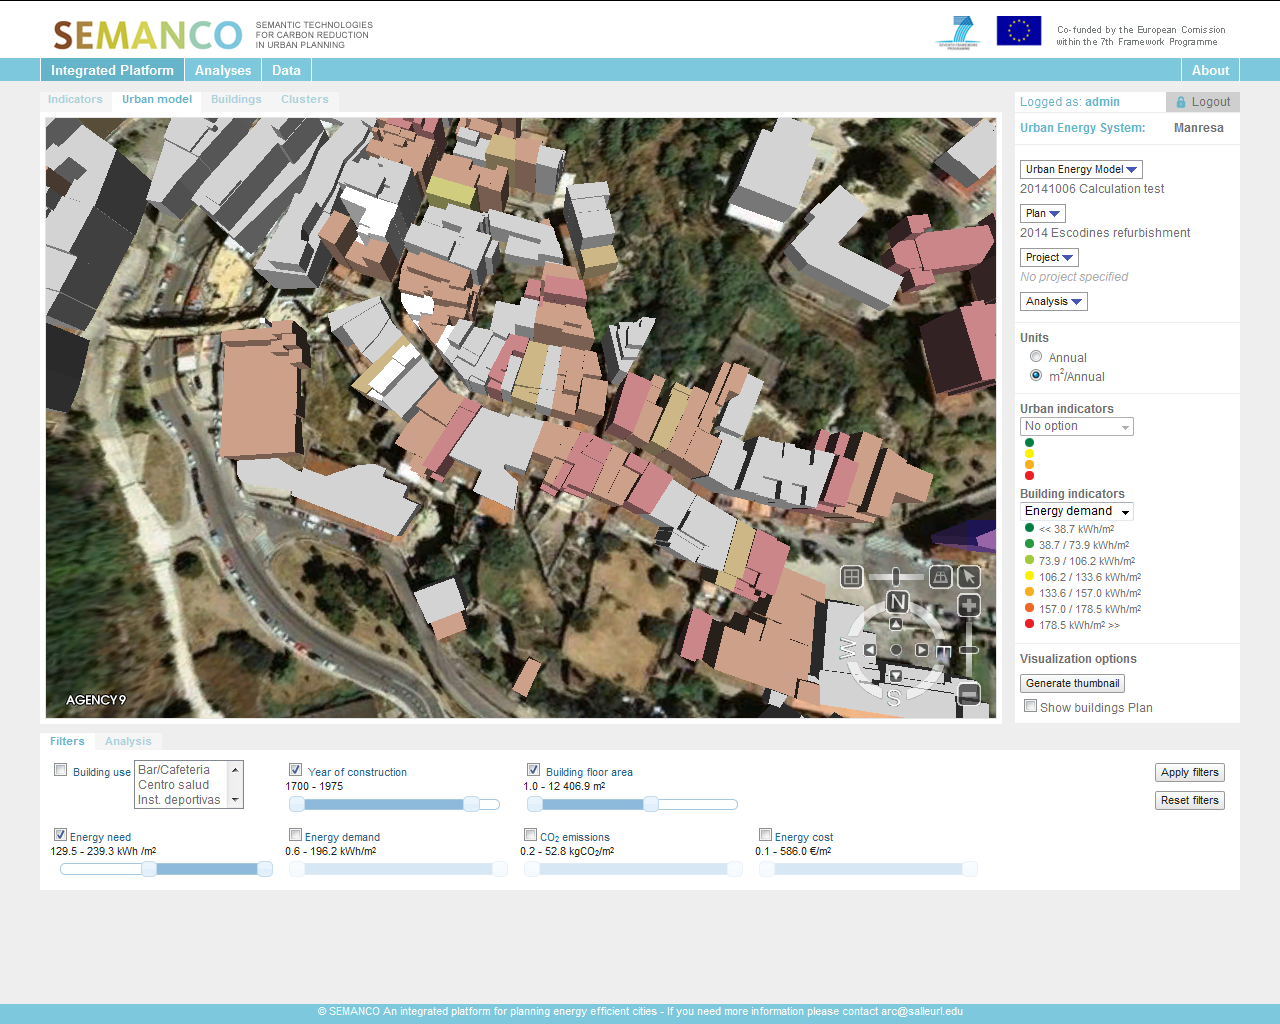
Since the housing company owns a large amount of buildings in the area and the budget is quite limited, the user utilizes the ‘filtering feature’ to focus the target area. Firstly, s/he colours the buildings according to data in the “energy demand” indicator and then s/he removes the colour of those built after 1975, since older buildings have the greatest potential for implementing energy saving measures. Furthermore, the user also excludes the buildings with the lowest energy needs as well as the largest ones (largest surface area). These buildings are discarded due to the limited budget available.
3.3. Selecting and adding buildings in the plan
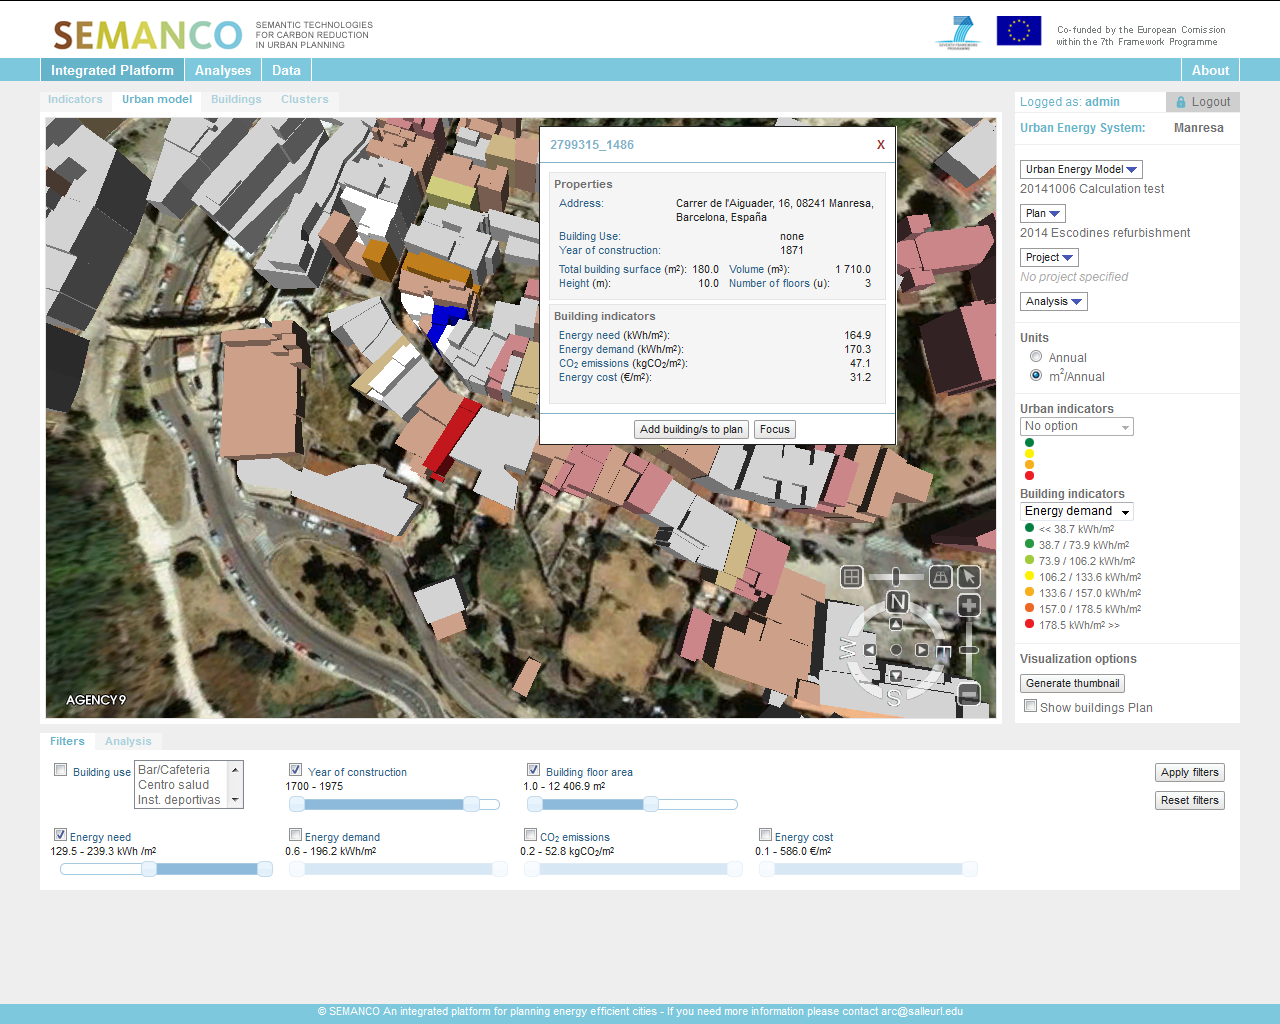
Once filters are applied, the user chooses two buildings coloured in red (i.e. with the poorest range of energy demand) and another building which, despite being coloured in yellow, s/he knows that there is a structural problem in the roof that needs to be repaired regardless of the proposed upgrades. S/he also decides to include another building in the plan that although is not coloured, the user is aware that the owners are willing to pay for a facade refurbishment.
4. Creating a set of refurbishment projects.
Several options of refurbishment are defined.
4.1. Create the projects
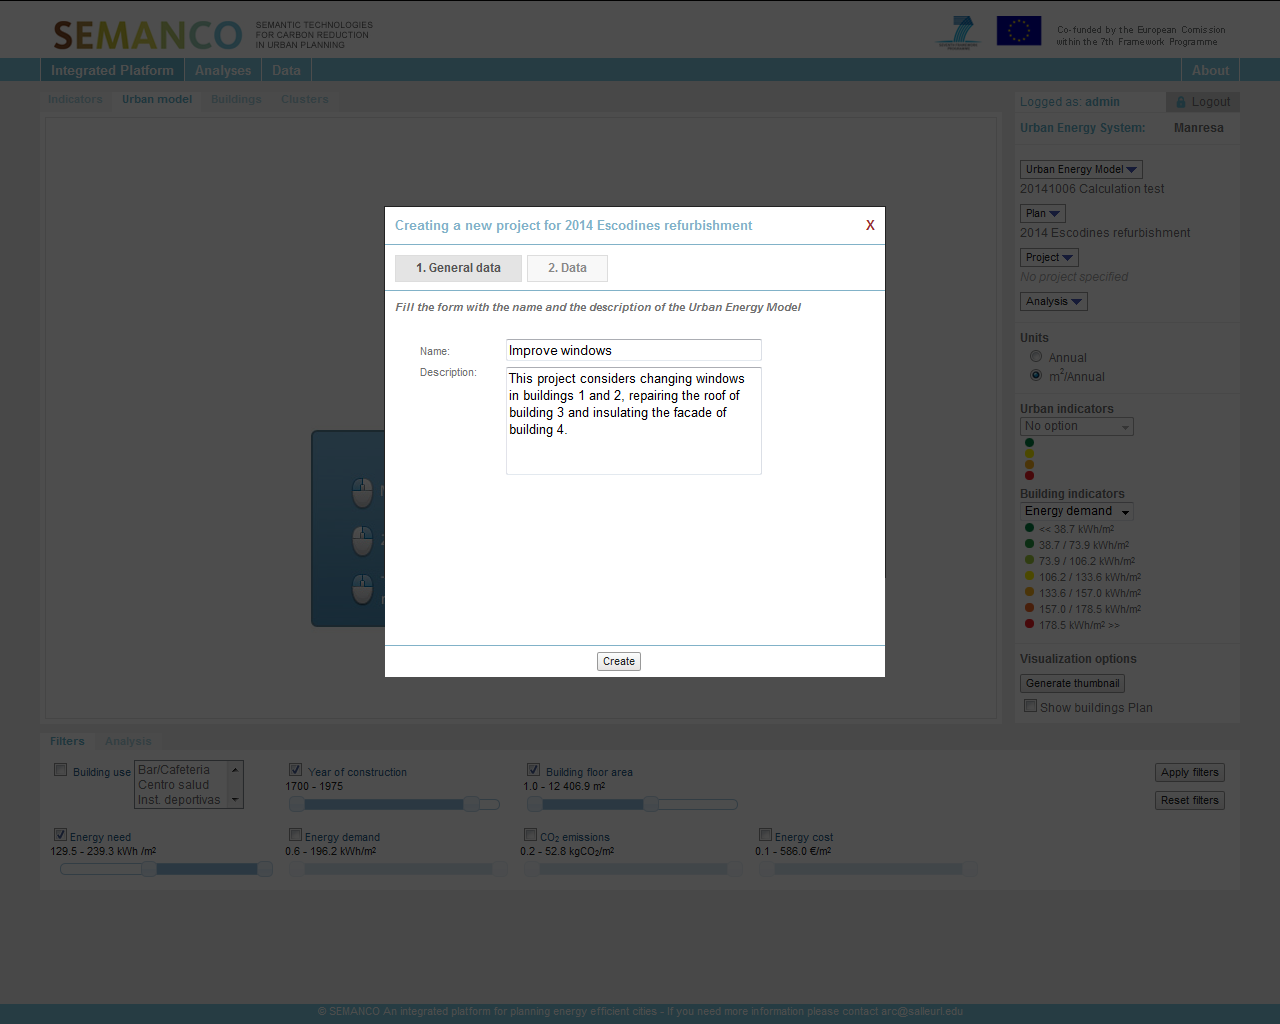
With the buildings included within the plan, the user wants to create several projects using a combination of buildings, actions, budget, and so on. The user names and describes each project, identifying which actions are being considered into each of them.
4.2. Simulate improvements for each project
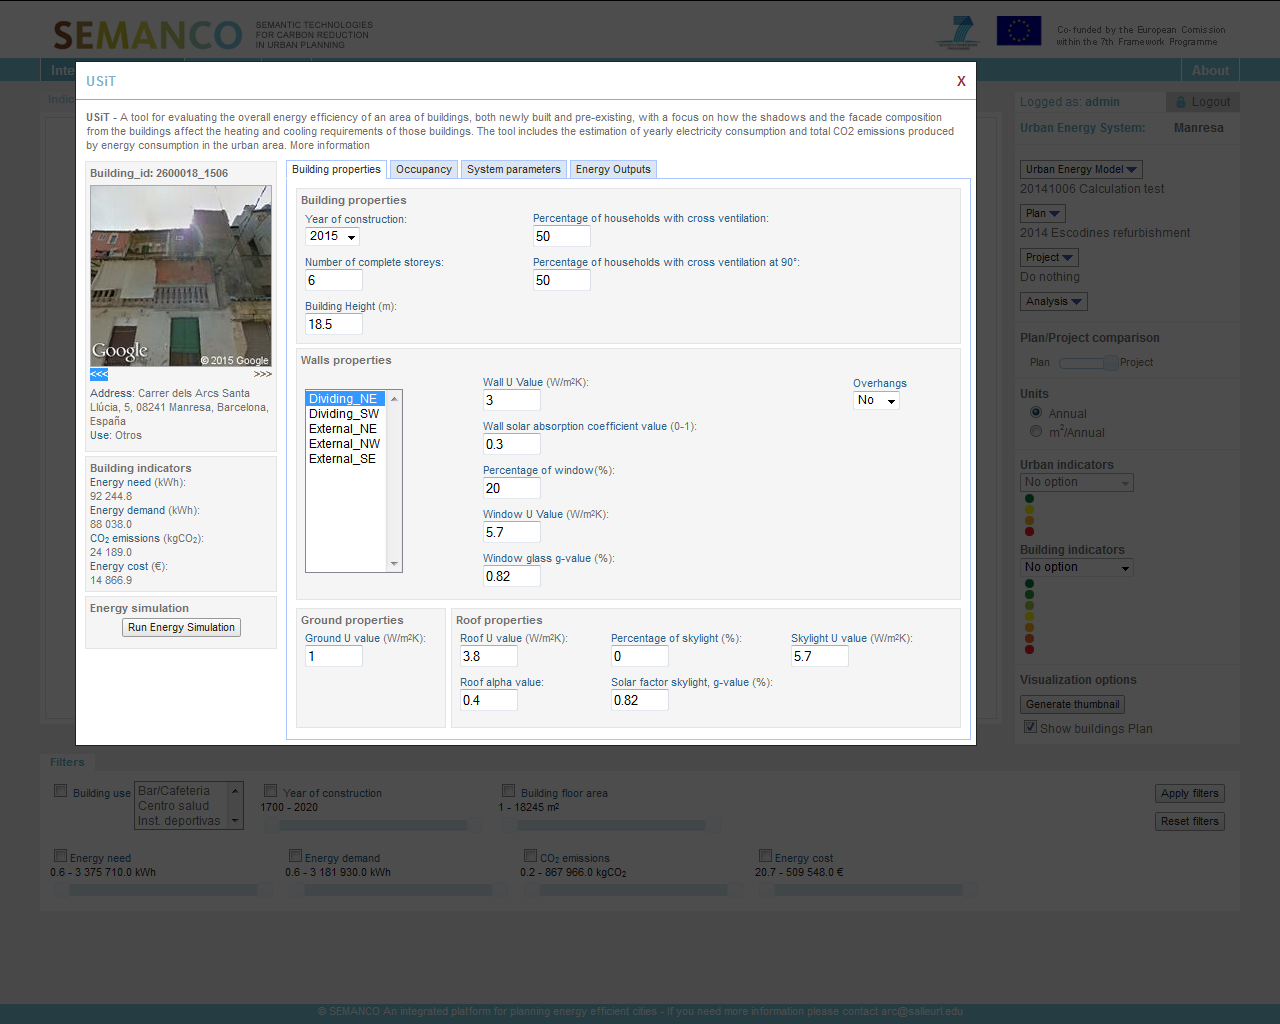
In each of the projects, the user simulates the improvements for each building by changing the corresponding parameter in the USiT tool. S/he does that by editing the corresponding value in the right tab in the form. This action is facilitated by the technical background and knowledge that the user might have about the situation of the buildings in the area.
4.3. Simulating roof insulation improvement
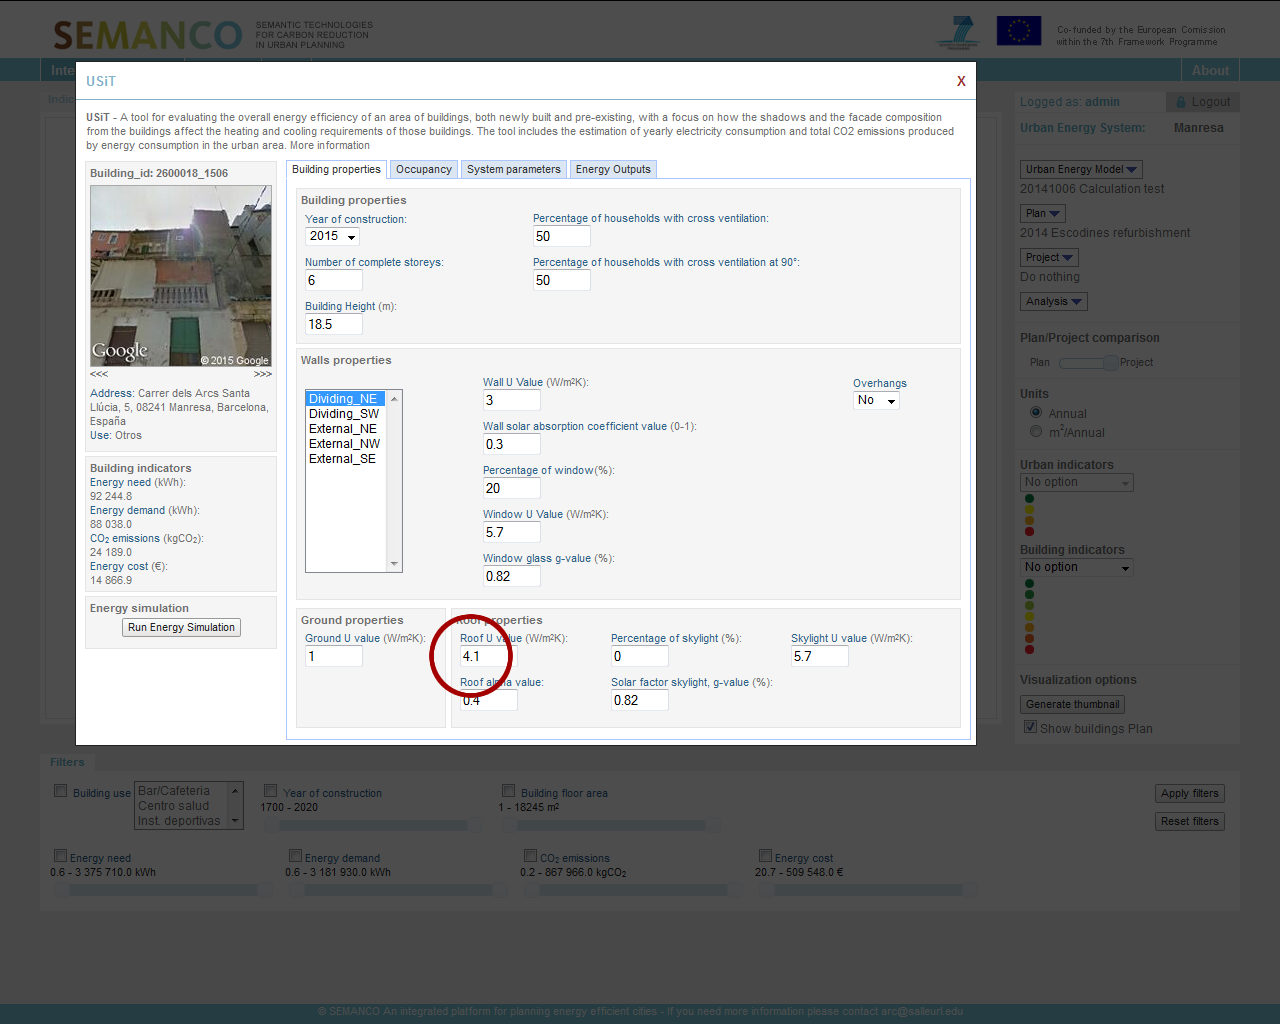
To improve the roof insulation the user changes the value in the “Roof U value (W/m²K)” field, which is located in the “Building properties” tab of the form. A wooden pitched roof with 4 centimetres of EPS insulation has a U-value of about 0.81 W/m²K.
4.4. Simulating improvement of windows
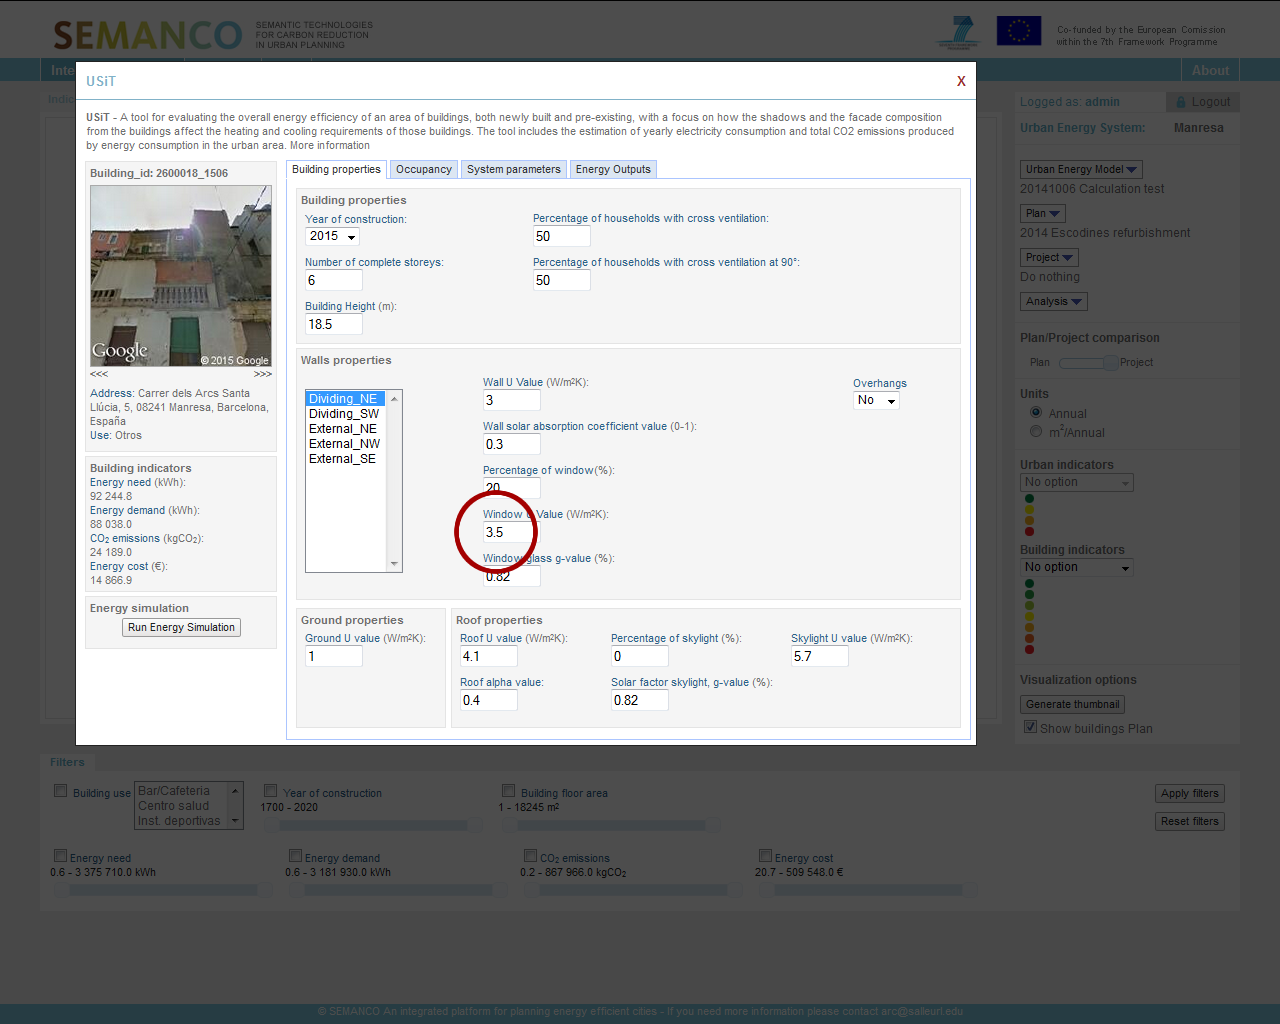
To improve windows facing north, it is necessary to select ‘walls oriented to North’ in the field “Walls properties” in the “Building properties” tab. Then, the user changes the “Window U Value (W/m²K)” and “Window solar factor, g-value (%)” with values corresponding to a new window, for example, to a window with double glazing and aluminium frame with thermal break has a U-value of 3.30 W/m²K and a solar factor of 75%.
4.5. Completing the list of projects
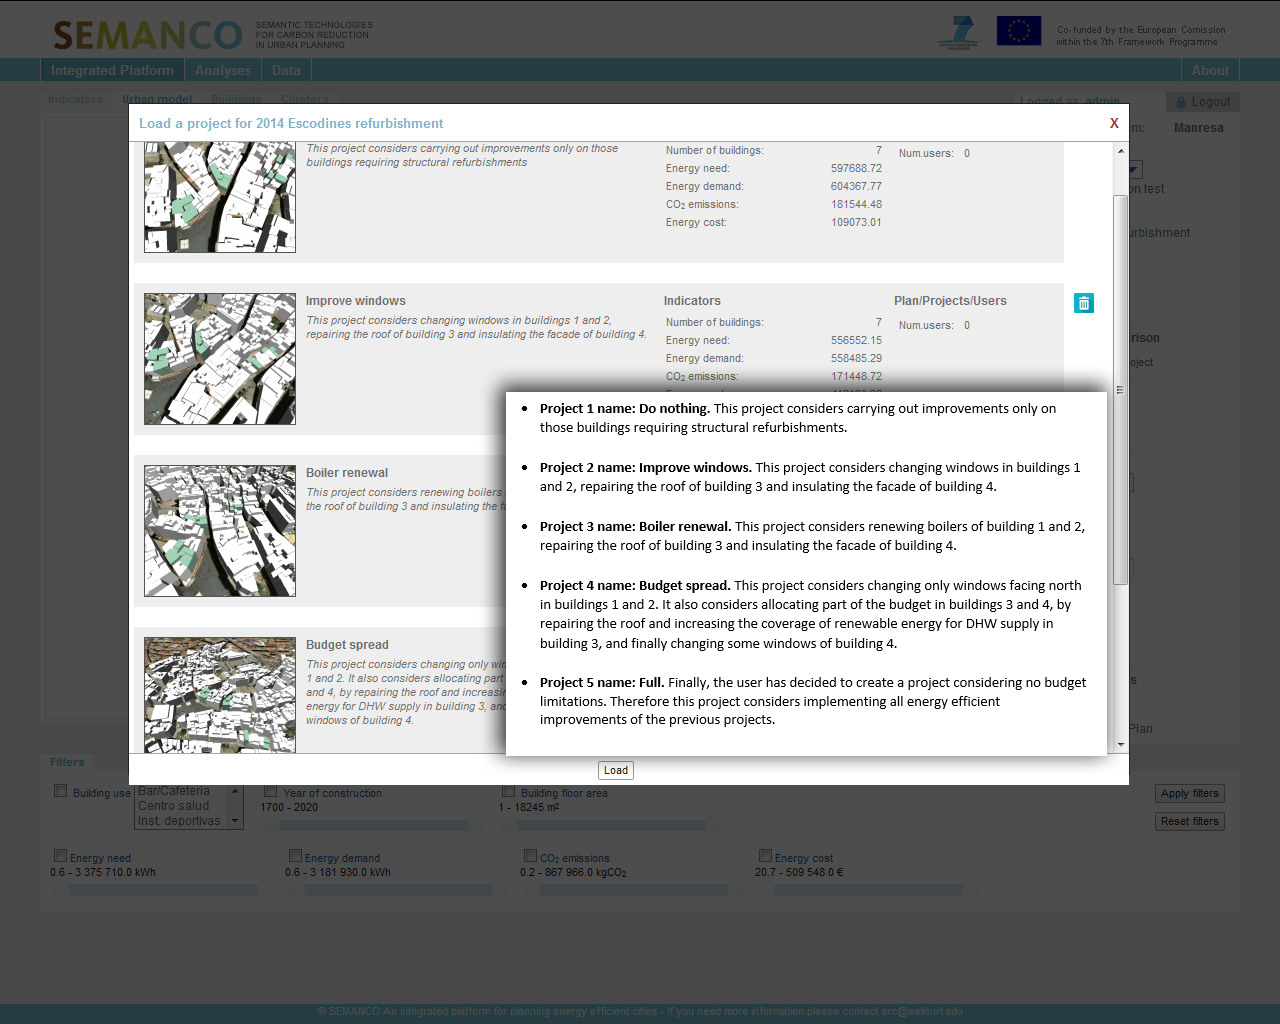
By following the described procedure, the user creates a set of projects with by introducing the refurbishment parameters in the USiT tool.
5. Evaluating the different projects.
The attributes of each option are considered against the yearly budget.
5.1. Creating a new Analysis
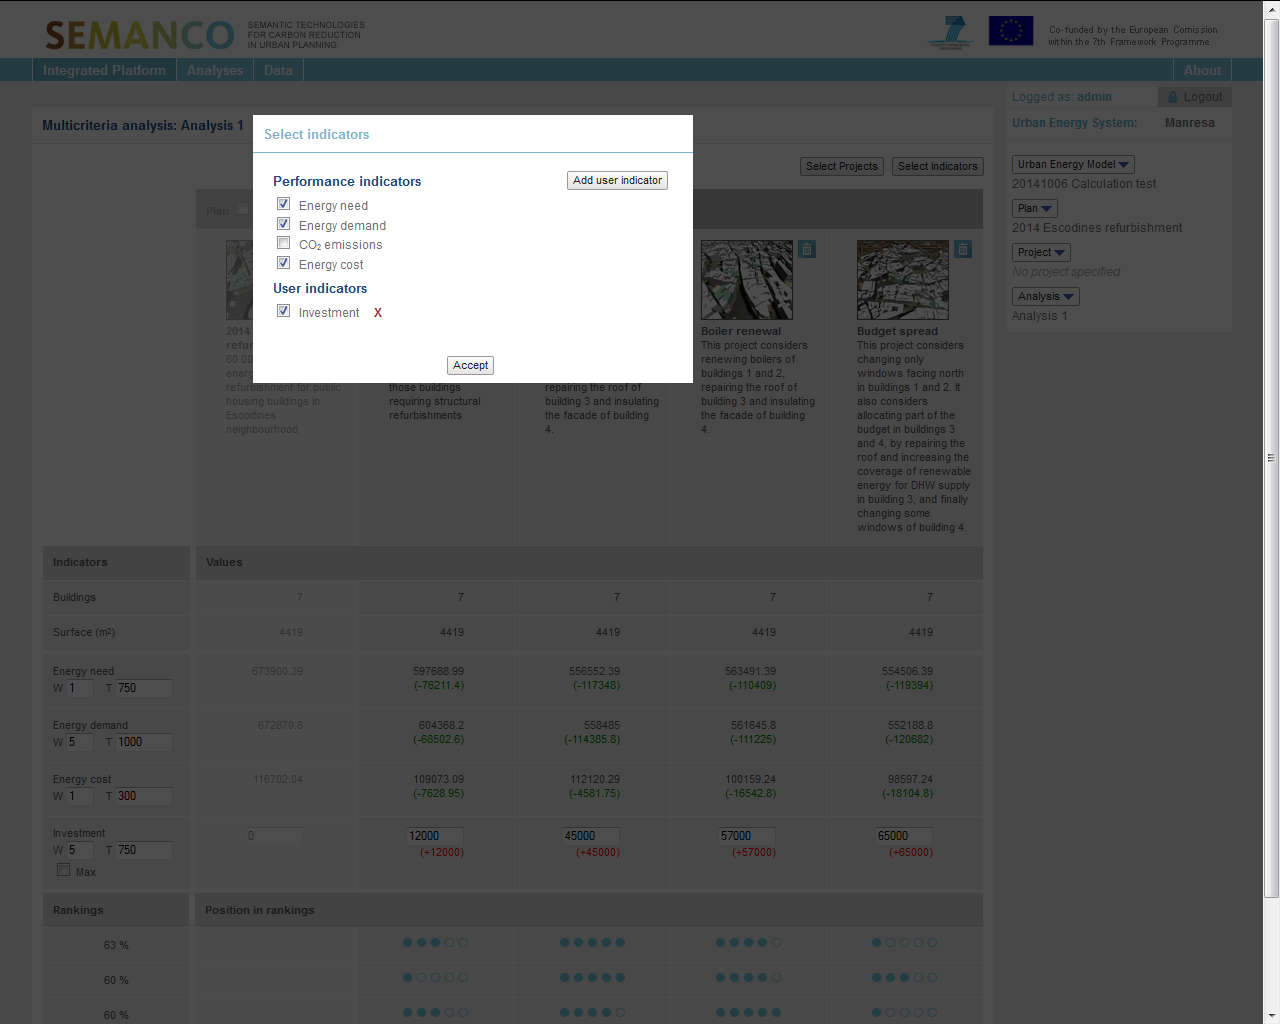
As part of the MCDM analysis, the user creates “Analysis 1”. As the tool only allows comparison of up to 4 projects, the user decides to discards the “Do Nothing” option for the first analysis. When all the options are in place, the user checks the list of indicators. S/he removes then the “CO2 emissions” indicator and adds a user-defined indicator to consider the cost for each of the options.
5 2. Setting the comparison and testing the results
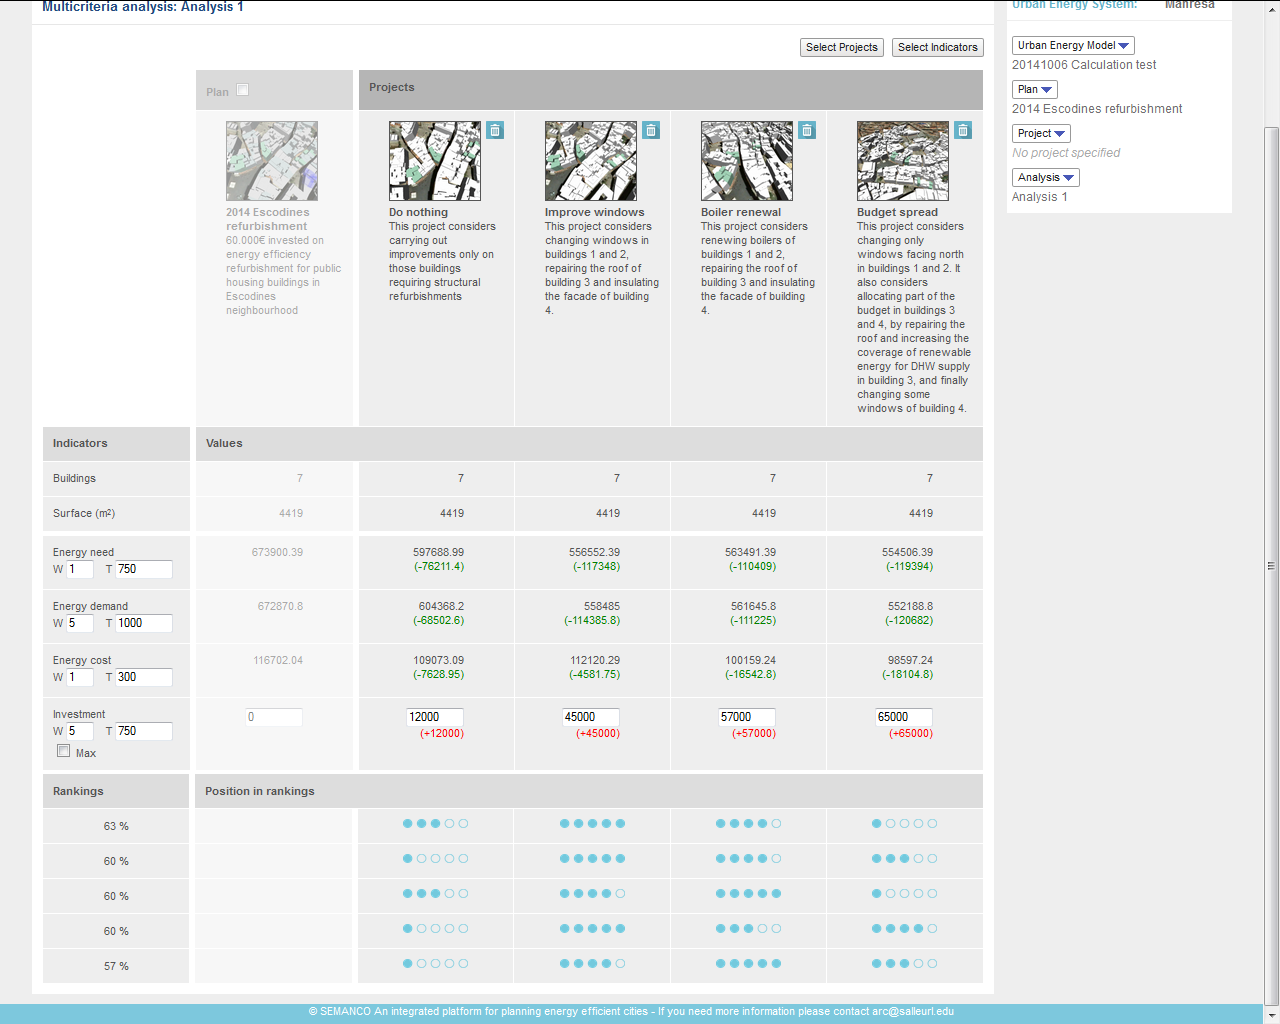
The user sets both the energy demand and the cost of the investment as the most important ones. After testing the results with diverse configurations, the final analysis removes the “Do nothing” option. The the preferred option is improving windows in buildings 1 and 2 and the roof in building 3. Now the user is confident about what should be presented to the management board as a good option to allocate the yearly budget.