This application case explains how the functionalities and services provided by the SEMANCO platform can help urban planners and developers illustrate the effect of different proposed building codes and energy standards for new buildings.
The user is working either as a municipal energy planner or an urban developer for the municipality. The municipal planner is interested in evaluating a new proposed building code and hence more strict energy standards and its effect on net energy demand, CO2 emissions and energy costs related to the new urban area.
The SEMANCO platform enables the user to make a more informed decision about whether these proposed changes in energy standards enhance the energy performance of the buildings. The user will set up an analysis that compares different energy intensities for buildings and are thus able to benchmark the result on indicators such as energy costs and carbon emissions. The results of the comparison will enable the user in his/her work to show the effect on a more strict building code for the new urban area.
The steps in this process are outlined below
1. Selecting the Urban Energy Model (UEM) of the area object of study.
This model has been previously created with the available data and tools.
1.1 Selecting the Urban Energy Model (UEM)
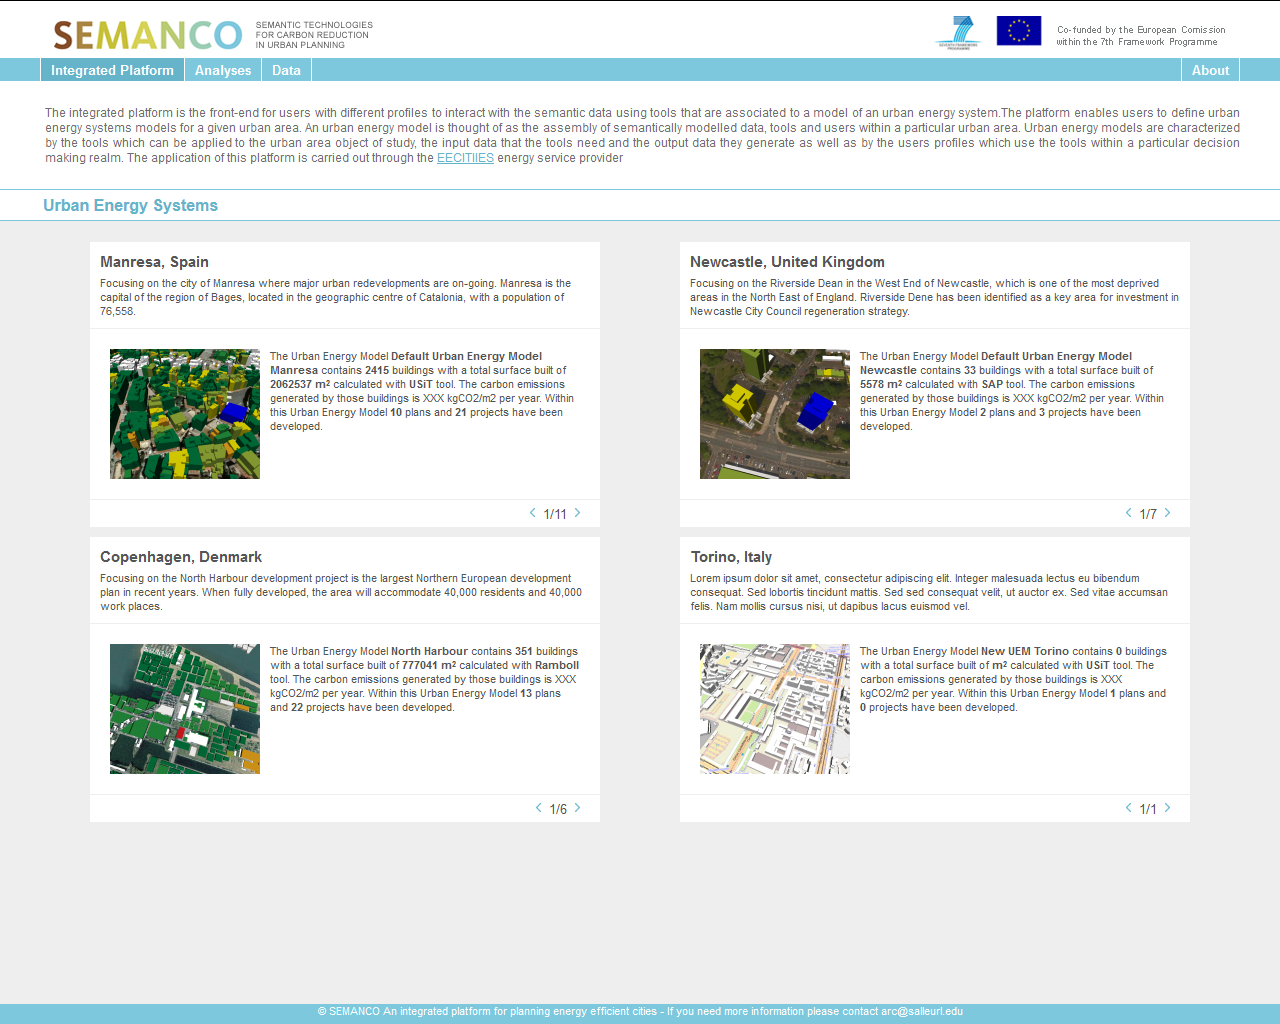
The user selects both the city and the specific Urban Energy Model (UEM) from the main screen and logs into the platform. The UEM defines the rules to perform the evaluation. This UEM has been set previously by selecting the appropriate data and tools for the purpose of the study. In this case, the UEM for North Harbour, Copenhagen, Denmark is chosen.
2. Setting a plan for an urban area.
A new plan is created to facilitate the coming analysis.
2.1 Creating a plan.
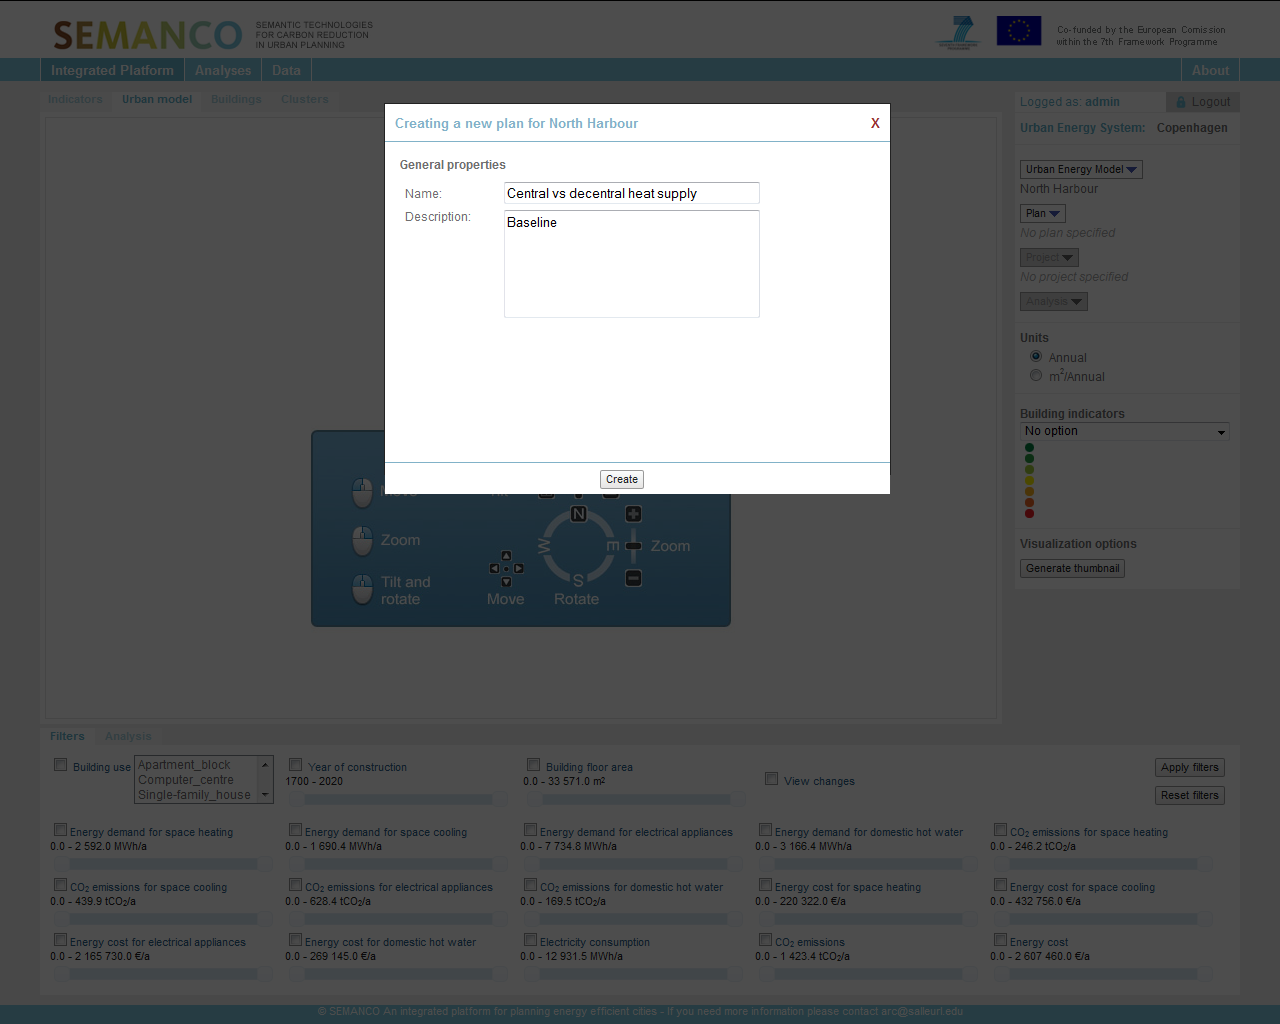
The user creates a plan “Central vs de-central energy supply” on which the coming different projects with different supply options are based. In other words, the plan will act as the baseline in the case of this analysis.
3. Selecting buildings.
Select and add buildings to the created plan in order to set the scope of the analysis.
3.1 Select and add buildings to the plan.
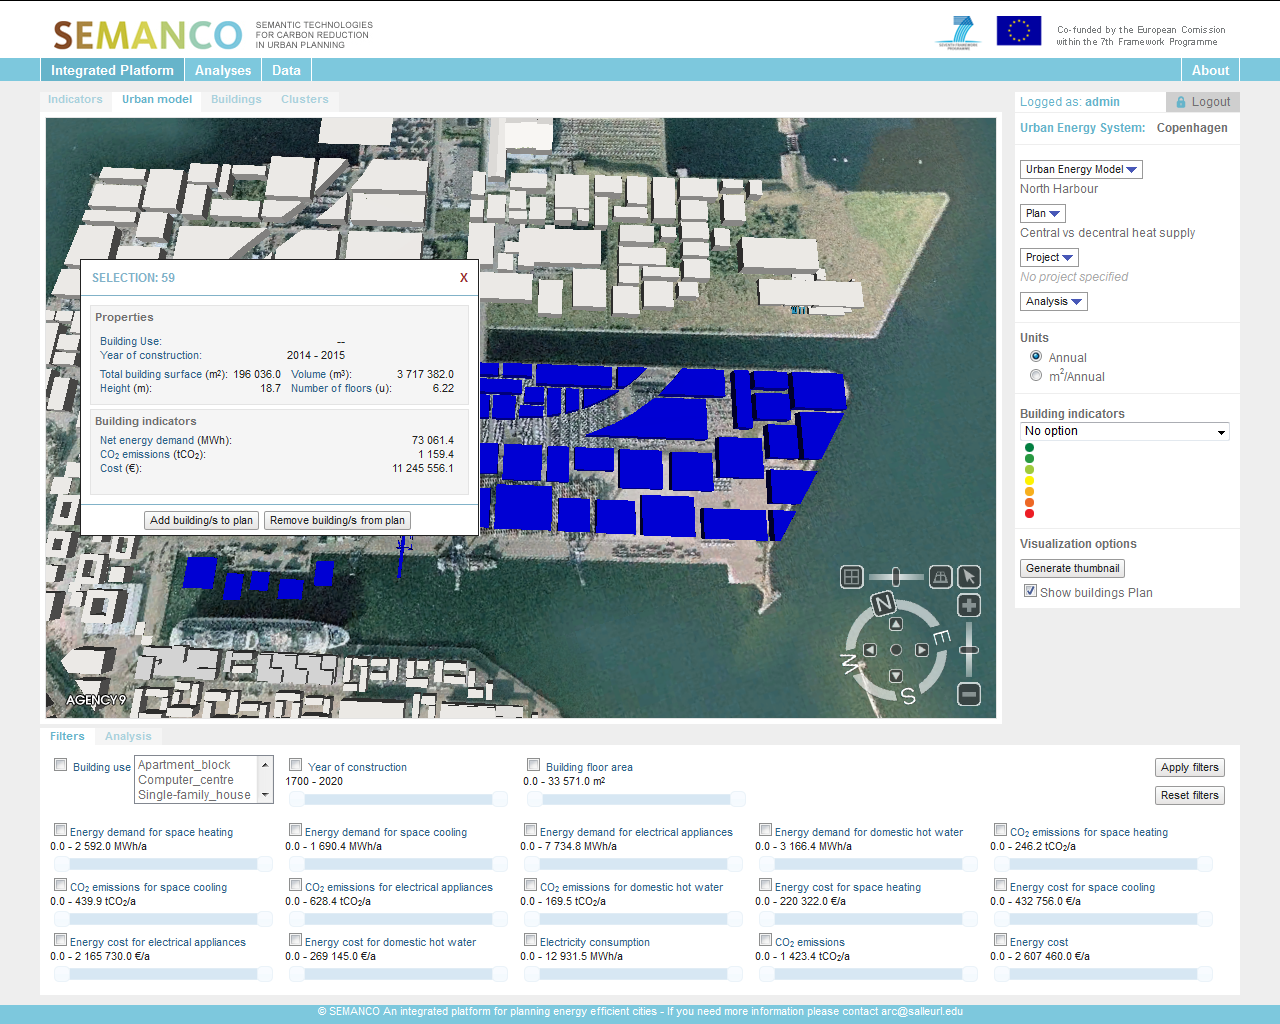
The user selects the buildings in a sub-area of North Harbour that she/he wants to analyse as regards energy supply options and adds them to the plan. The buildings selected and added to the plan will be the only ones that will be analysed further on. This enables the user to perform specific geographically defined analyses of neighbourhoods and districts within the urban development area of North Harbour.
4. Creating projects.
After the plan is created, projects can are created to explore multiple design alternatives.
4.1 Creating projects within the plan.
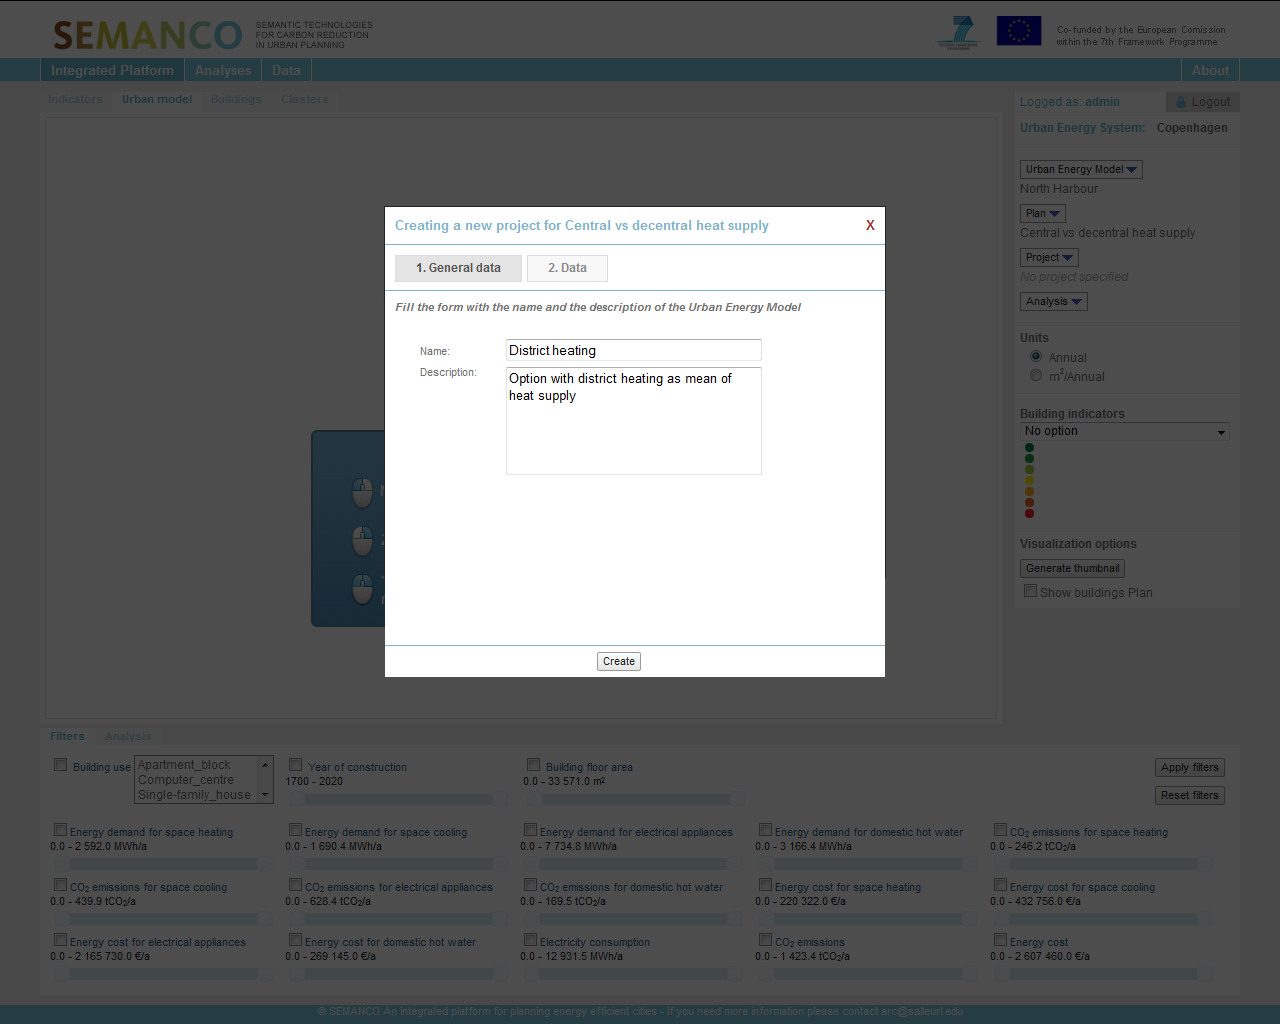
The user creates a project within the plan and assigns a meaningful name to it
4.2 Change energy intensities
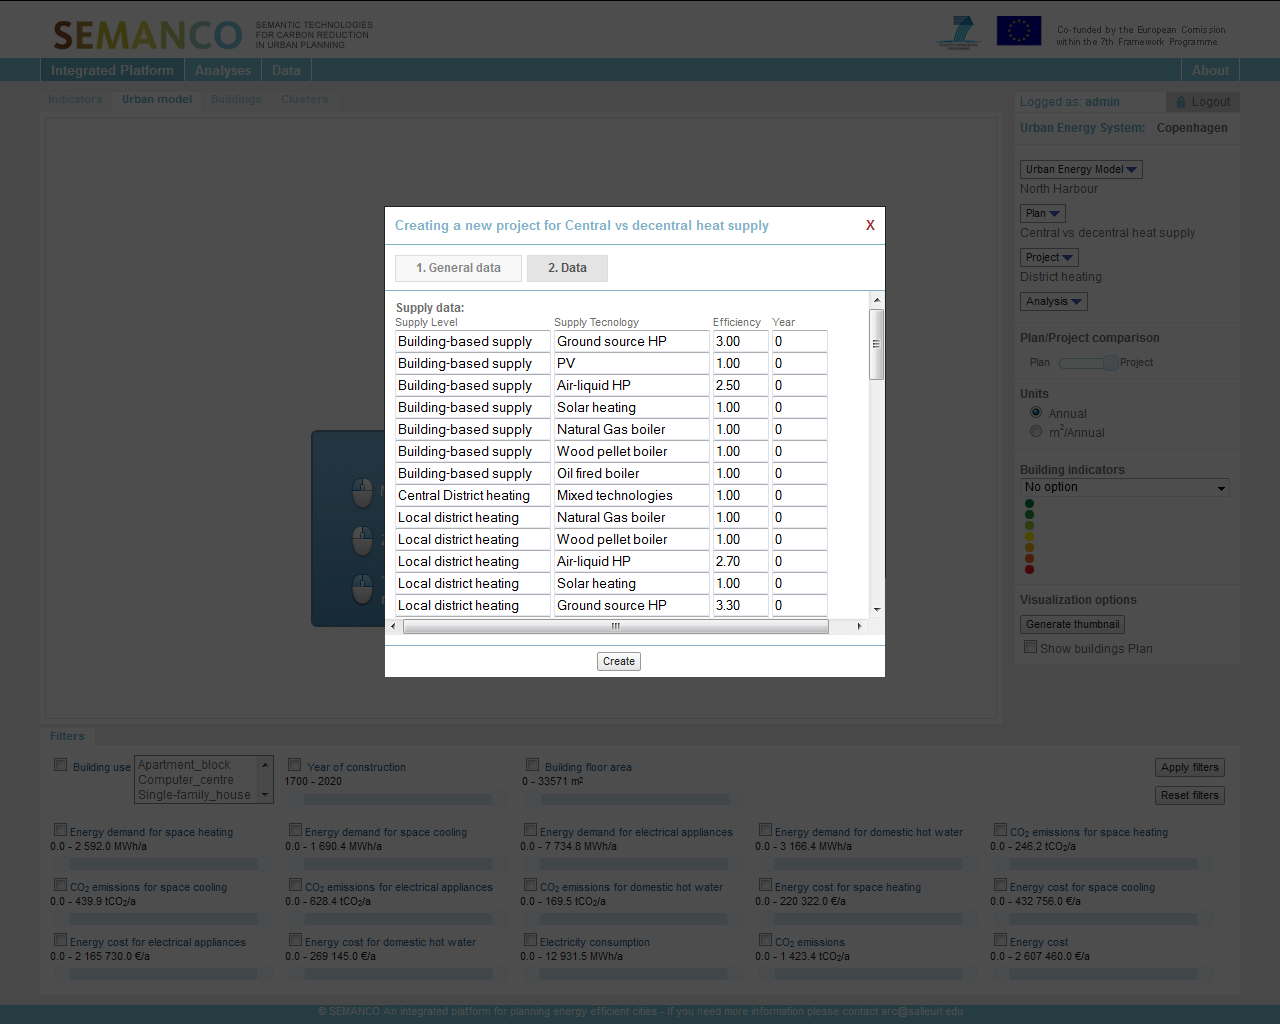
In the project creation windows the user swaps to the next tab, showing data, such as energy intensities for buildings and changes them accordingly to the expectations in the new building code.
5. Visualizing plans and projects.
The user can view the energy performance post interventions in the defined plan and projects.
5.1. Visualizing of plan and projects
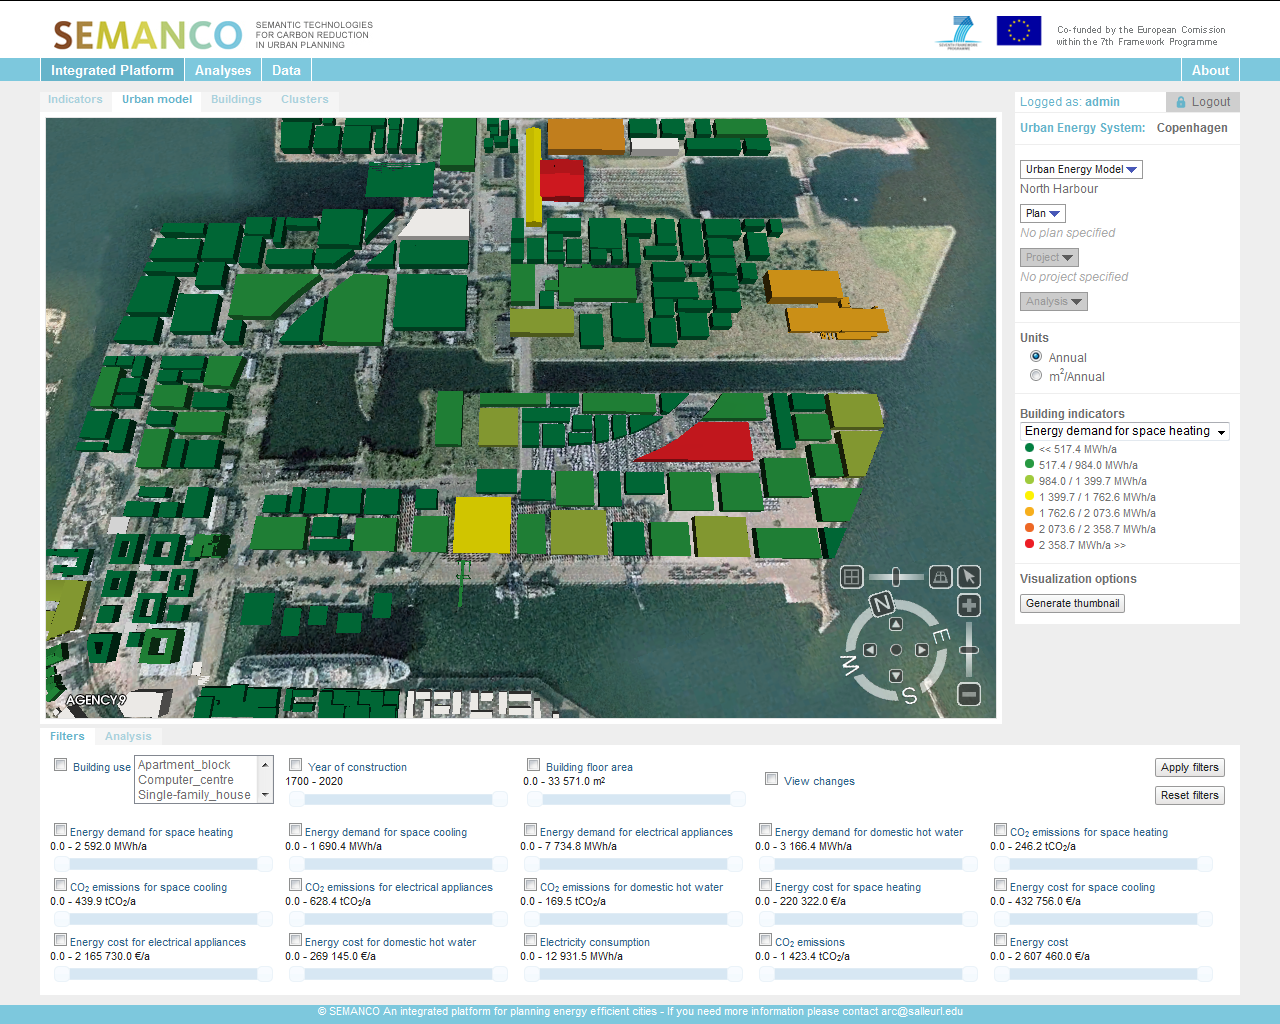
The user visualizes the changes to the model by choosing a ‘Building Indicator’ e.g. ‘Energy Demand for space heating’ as shown below.
5.2 Visualisation of plan.
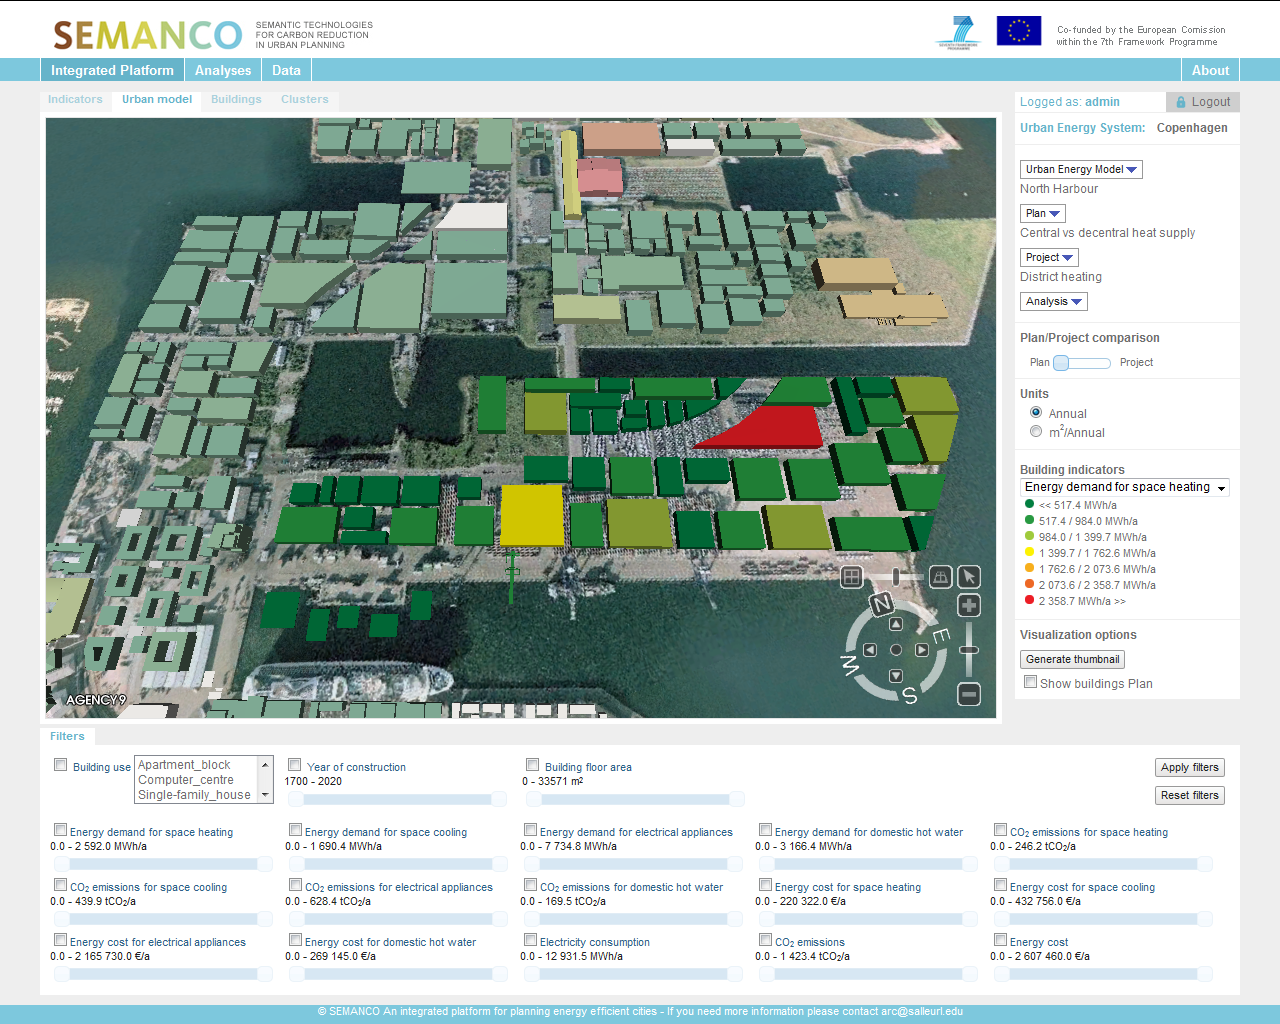
The user moves the slide to the left in order to visualize buildings indicators for the plan.
5.3 Visualize project.
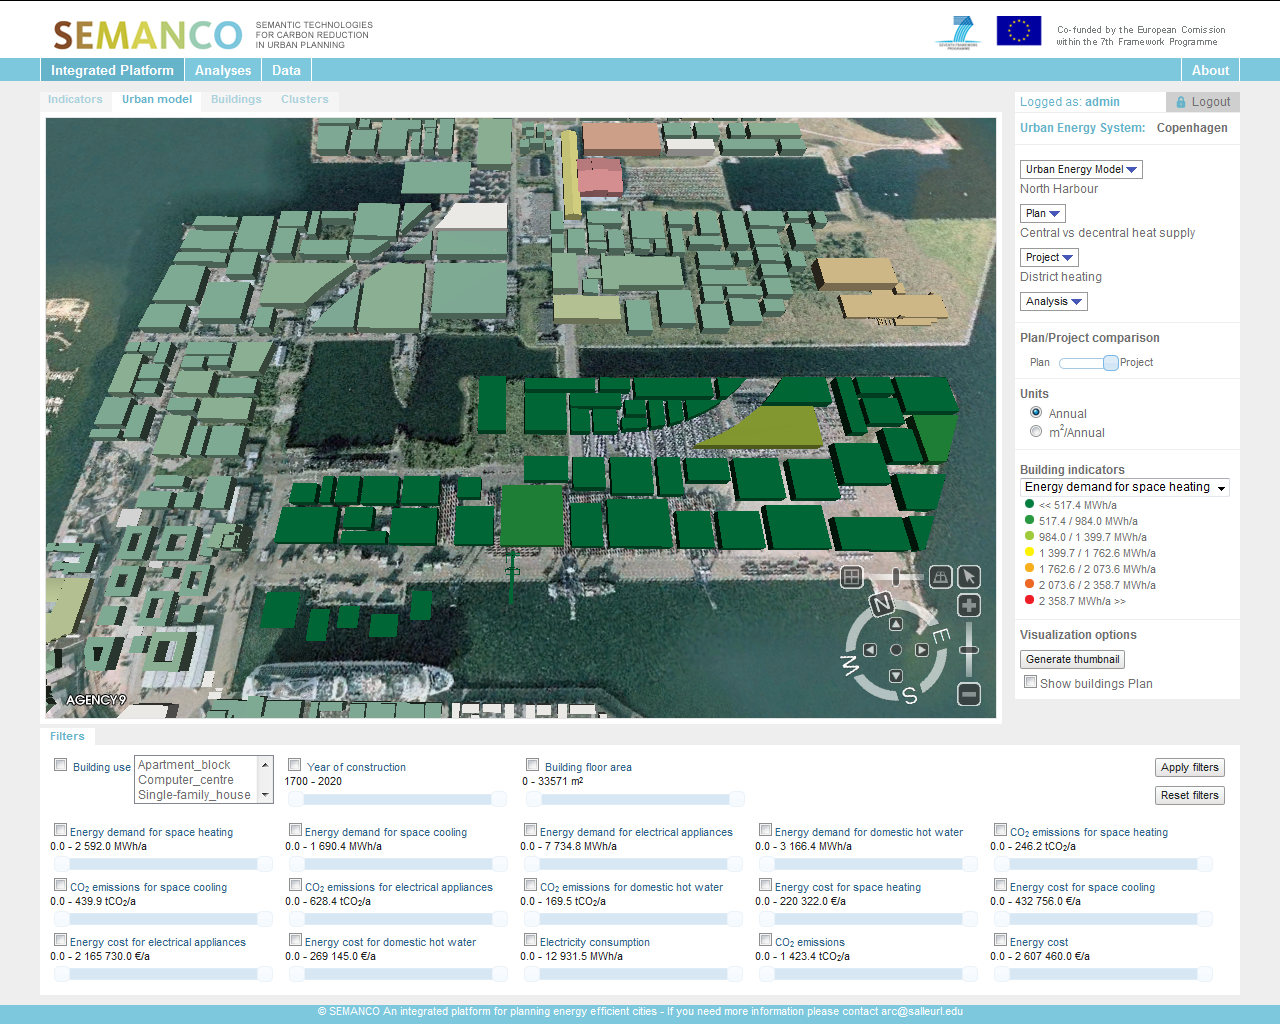
The user moves the slide to the right in order to visualize buildings indicators for the project.
5.4 Table view of results
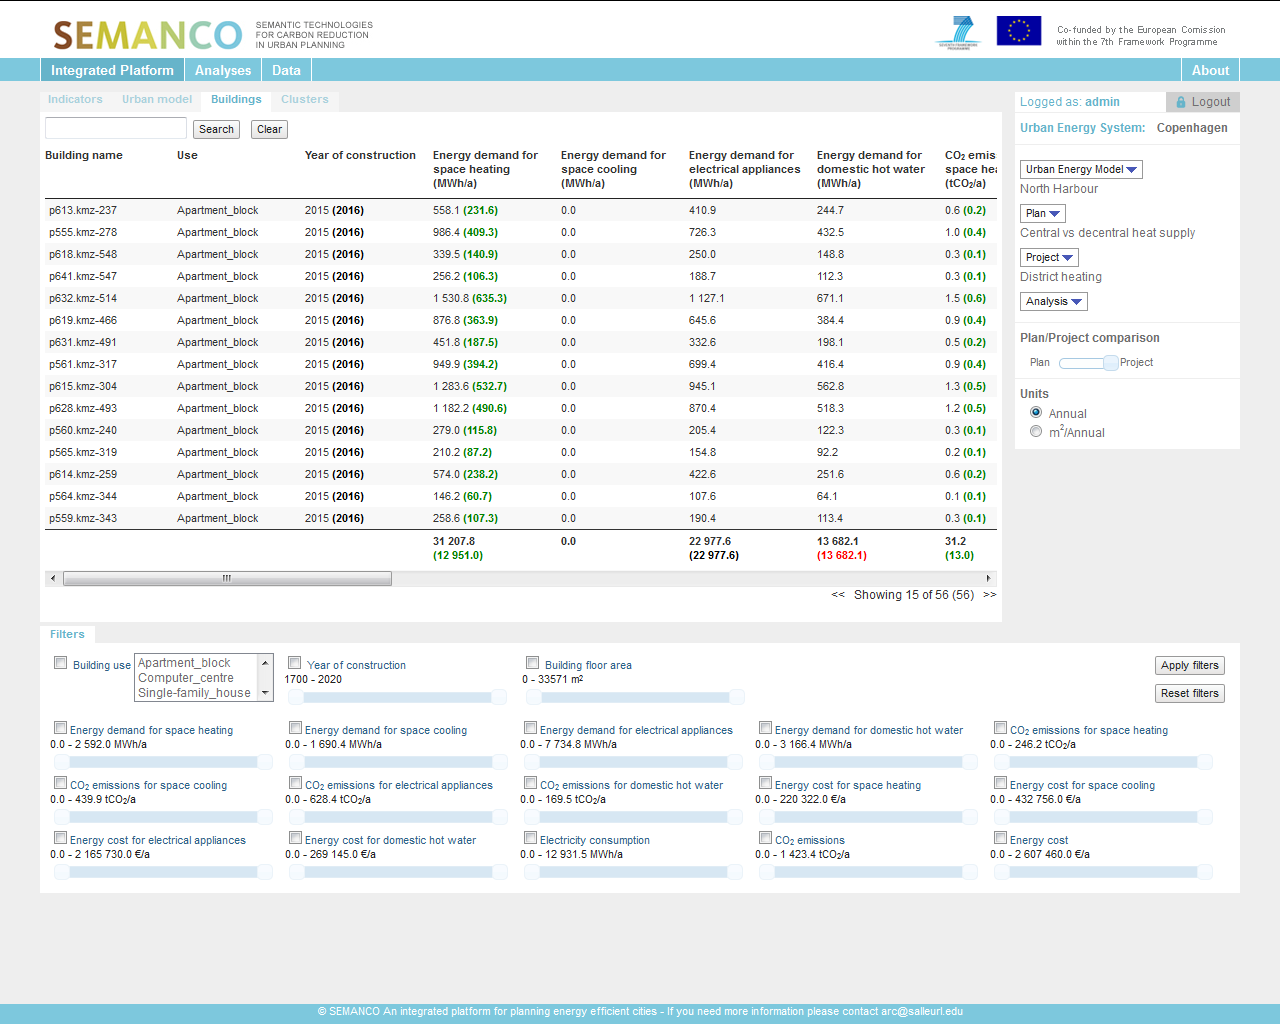
The user is also able to view the results in a table view where green and/or red numbers indicate a change in the value. In this instance, it is clearly seen that changing energy supply from space heating from heat pumps to district heating gives a clear benefit in terms of CO2 savings.
6. Evaluating the different projects.
Comparing the projects with each other
6.1 Creating an analysis
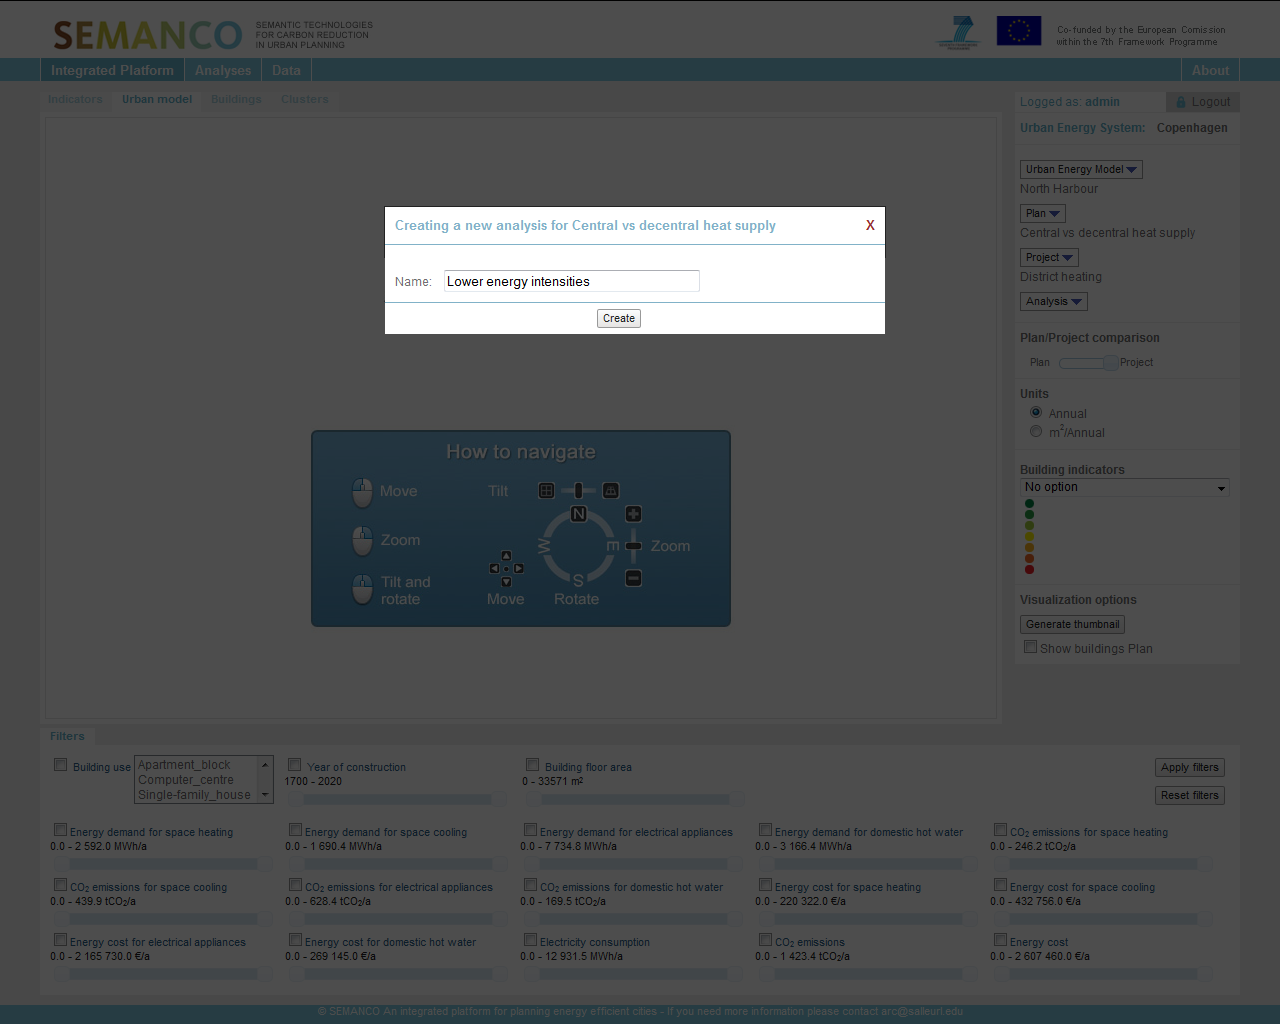
After the user has viewed the plan and the project with the different urban indicators and is satisfied with the visual result, he/she continues to the analysis part. The user begins the analysis by creating an analysis.
6.2 Multi-criteria analysis
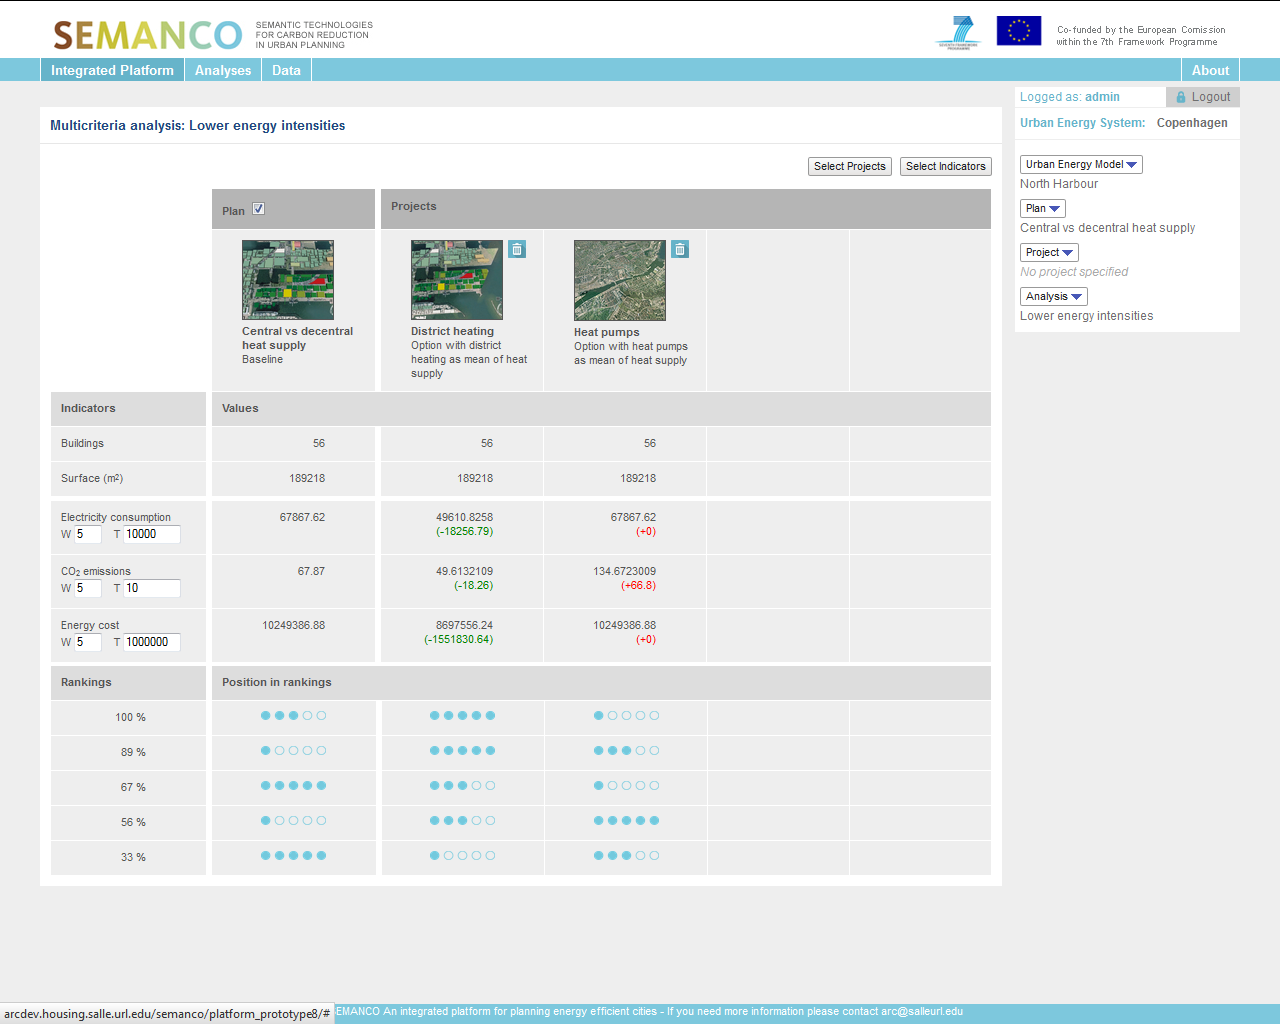
The multi-criteria analysis compares the plan and the project against each other on a set of different performance indicators. The outcome of the multi-criteria analysis are shown at the bottom, and it shows a clear benefit in terms of CO2 savings for space heating and hot water in the project with a more strict building code. Now the user is more confident about what s/he should present to her/his manager in terms of the impacts of a more strict building code in the proposed development area.