The technologies used by EECITIES were developed in a research project called SEMANCO – Semantic Tools for Carbon Reduction in Urban Planning. Different tools to assess and analyse the energy efficiency of buildings and urban areas are integrated in the SEMANCO platform. The application of the tools requires the creation of an urban energy model. The model is created with the geometric information of the urban area, which is transformed in an interactive 3D model visualised with the software 3DMaps. Energy related information is integrated to the geometric model using semantic technologies.
URBAN ENERGY MODEL
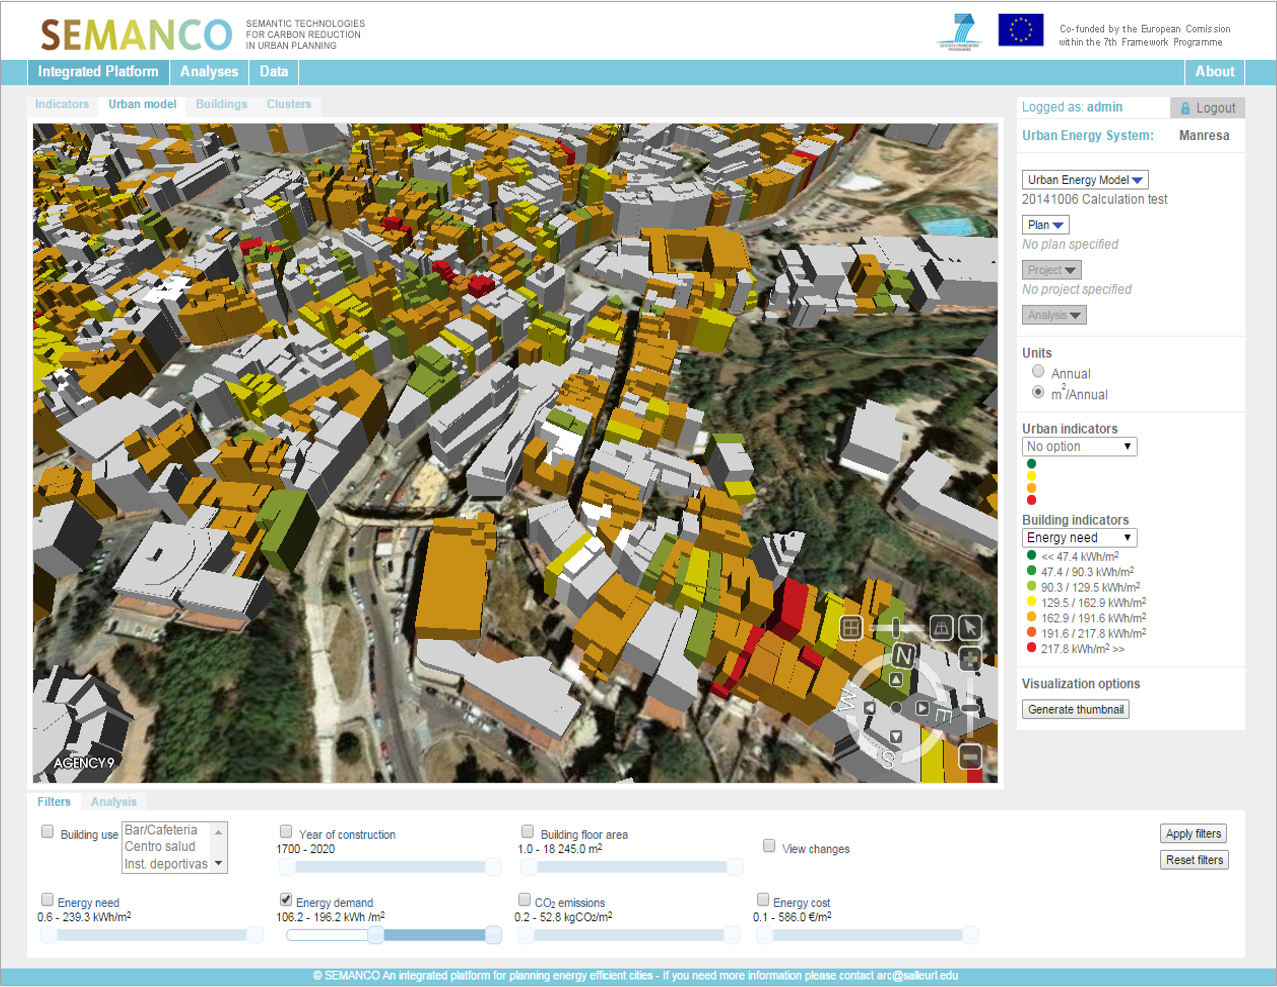
The creation of an urban energy model begins with a 3D geometric model of an urban area which is visualised in the platform using Agency9’s 3dMaps software. This model is built using the available geographic data facilitated by a Geographic Information System of a city. The 3D model of the city is a tailored process which depends on the source data provided. Cadastre, ortho-photos, height maps, and LiDAR surveys can be used to build the 3D model. The 3D model enables the user to visualise the urban area of interest and provides the geometry needed for carrying out the energy performance simulations.
Using semantic technologies the 3D geometric model is populated with energy related data to create an urban energy model. This data comes from external data sources (cadastre, consumption, economic and social indicators) and from the data generated by the energy assessment and analysis tools included in the platform. Urban energy models combine the integrated data – geometric, energy related- with the tools that are used to assess the energy performance of the buildings contained in the model. It can be visualised in multiple forms in the SEMANCO platform: interactive 3D model, charts, tables and lists. The various users can access this information to help them understand the energy performance of an urban area.
Urban energy planning
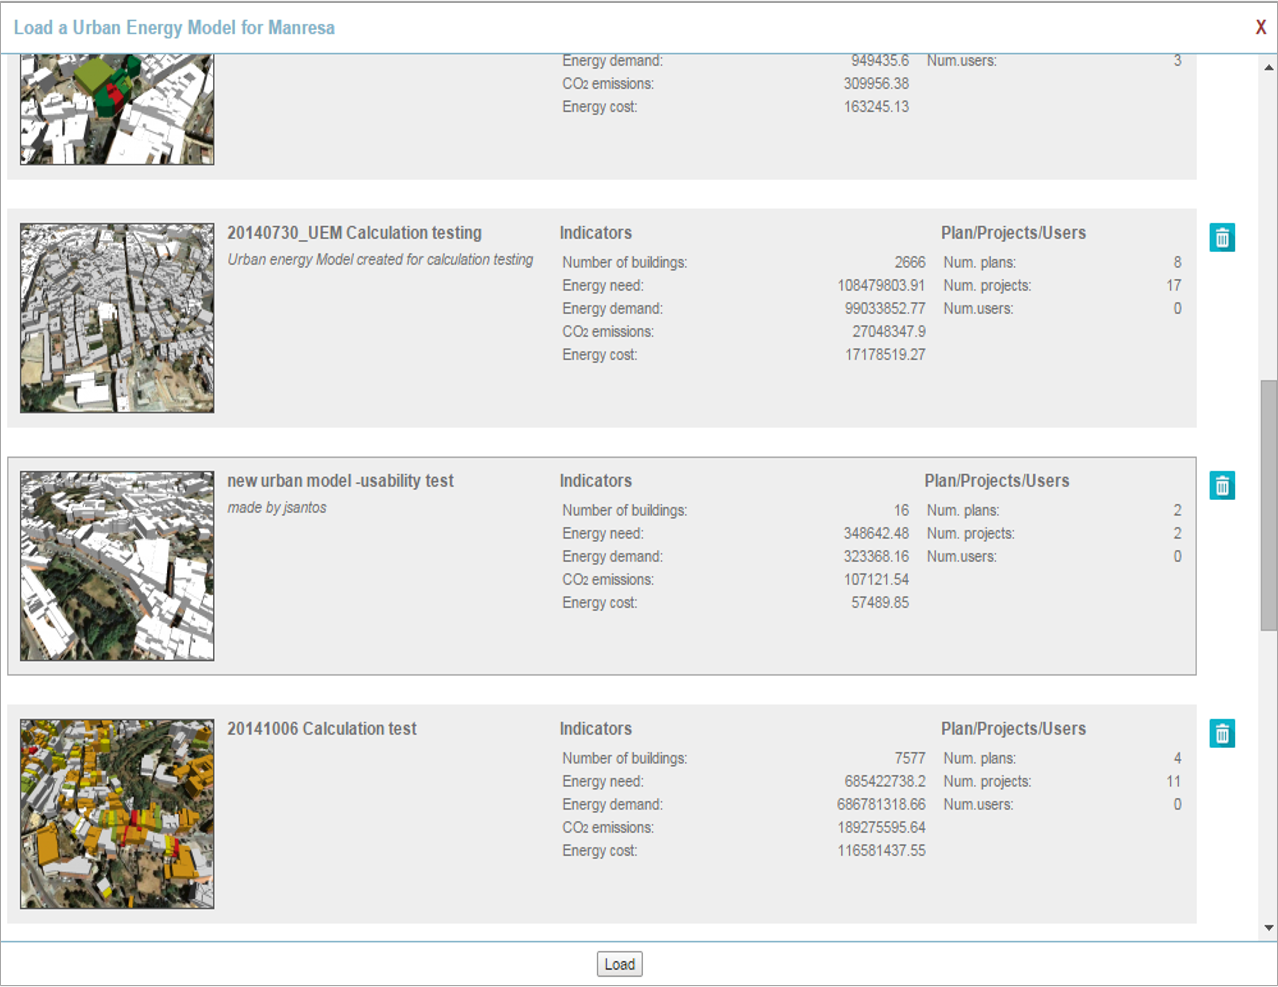
The energy assessment and analysis tools are applied to evaluate the current level of performance (e.g. a baseline) of buildings included in an urban energy model. The analysis of the current performance helps to identify key areas of intervention to improve the existing conditions. Then, plans and projects can be devised and their performance checked against the baseline conditions. A plan refers to the actions to be taken in a specific area of the urban energy model (a block, a neighbourhood or a set of geographically dispersed buildings).
A ‘project’ consisting of set of measures taken to improve the building energy performance of the buildings included in the area of the plan can be developed. For a given urban energy model, any number of plans can be created and for each plan any number of projects. Plans and projects can be created for both in greenfield and brownfield sites.
Energy assessment of buildings
A set of tools are integrated in the SEMANCO platform which can be used to assess the energy performance of future and existing buildings these include:
- SAPMAP (SAP estimator and decision support tool), based on a simplified standard assessment procedure for domestic energy usage used in the UK. It is used to assess the current state of domestic buildings and evaluate the costs and benefits of the possible interventions to improve the current state.
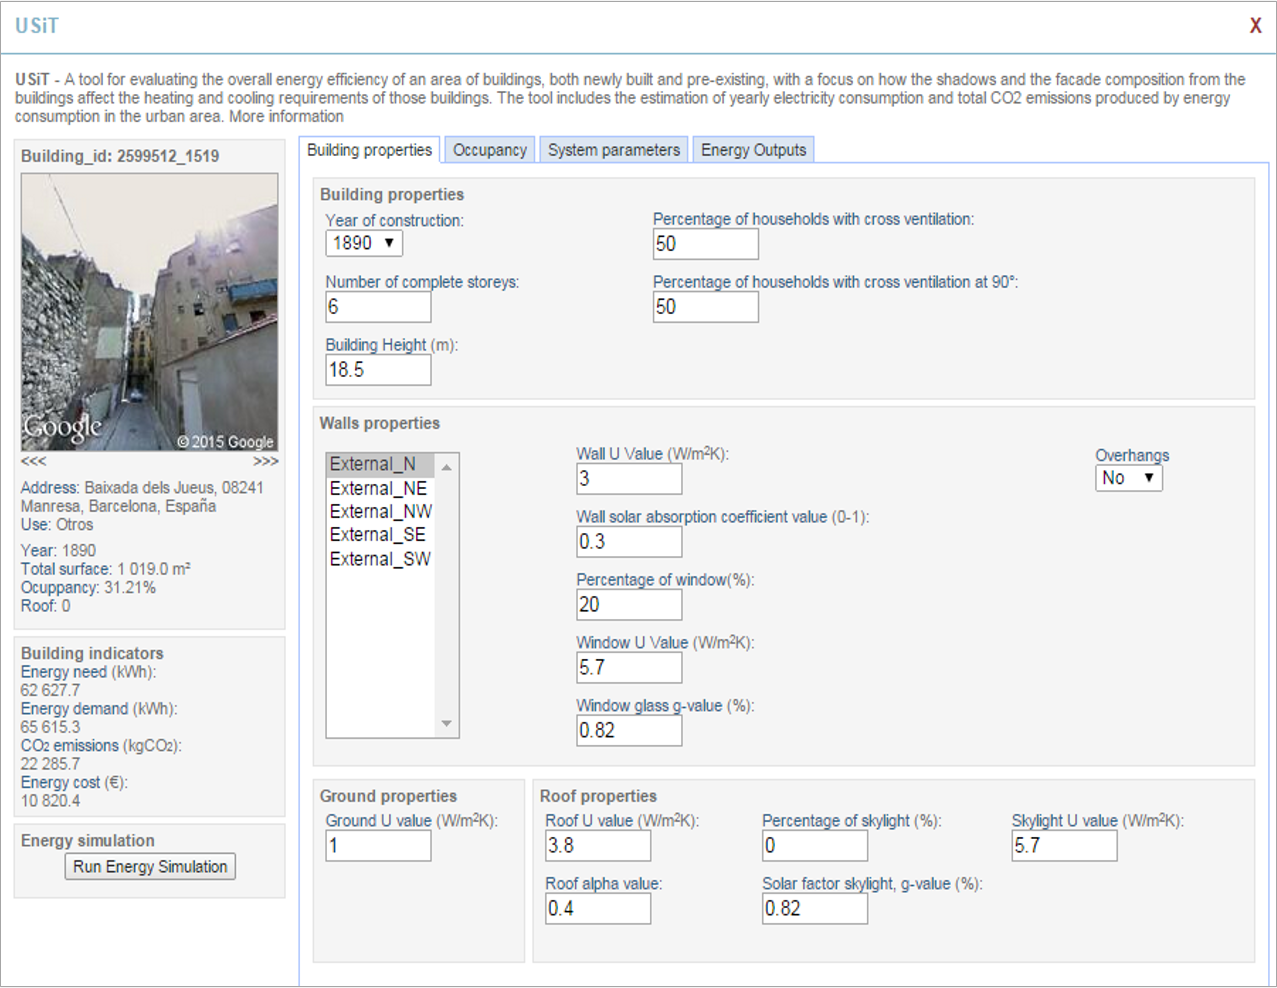
- USiT/USiT-improvement a tool to simulate the energy performance of urban areas based on the URSOS simulation engine. It enables the calculation the current energy performance and assessment of the impact of the measures to improve it.
- UEP (Urban Energy Planning tool)/ UEO (Urban Energy Optimization tool). The UEP tool assesses energy demand and the UEO tool determines the optimal combination of measures to achieve sustainable energy supply and energy savings.
- Mine-On (Data Mining Analysis Tools), it facilitates access to data mining processes using RapidMiner / RapidAnalytics technologies.
- Multi Criteria Decision Tool, that enables the comparison of the different plans and projects created to improve the existing conditions of buildings in an urban area.
These tools are integrated in the current version of the SEMANCO integrated platform. Additional tools can be developed and integrated in the platform to respond to specific requests.
Cluster analysis
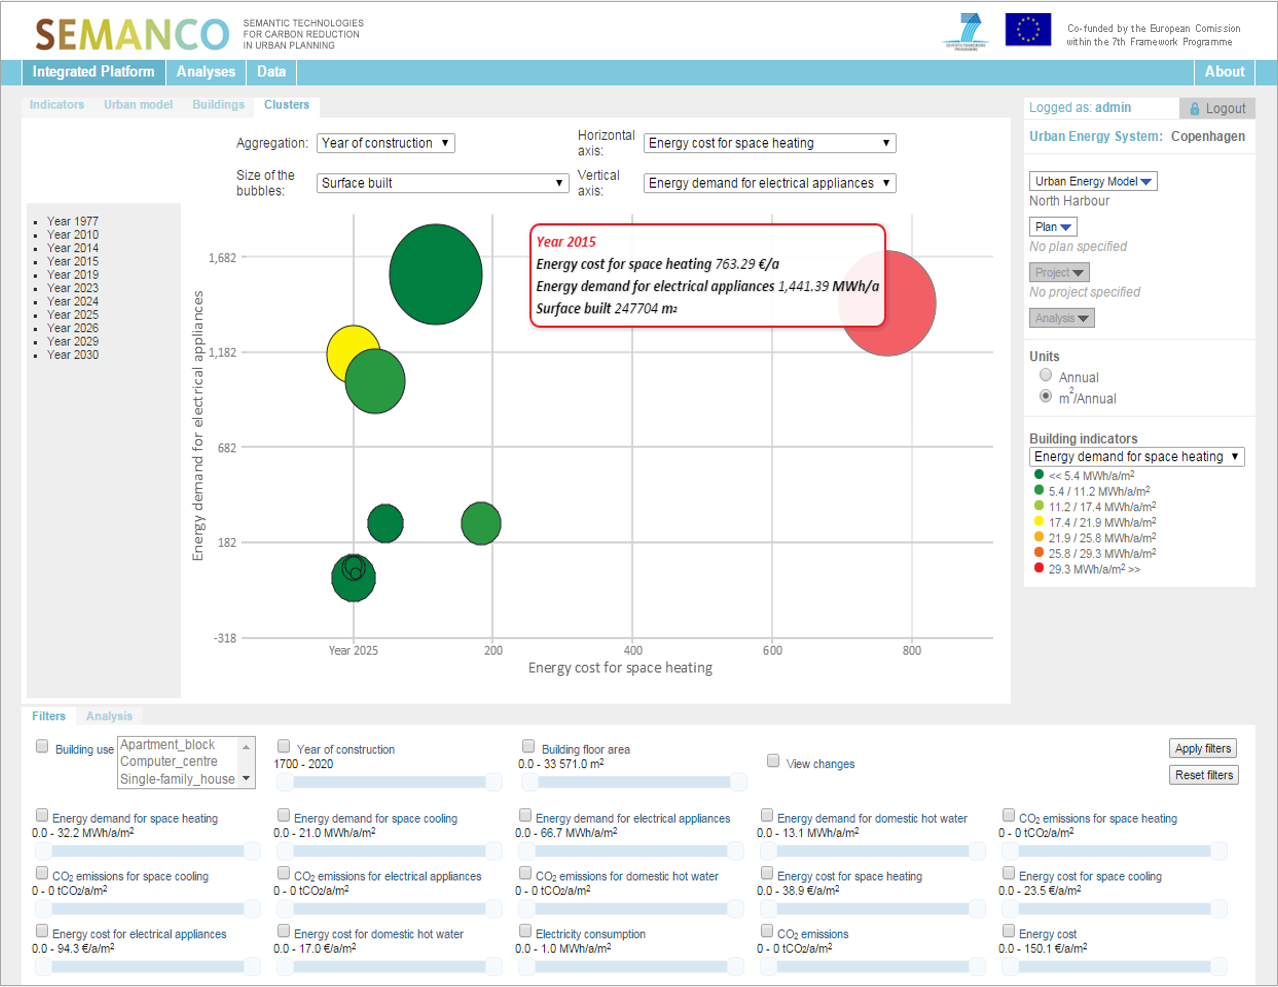
The combined data of an urban energy model is analysed and displayed in diagrams and tables to highlight hidden patterns and hot spots. Advanced analysis can be requested by domain experts (i.e. energy consultants, urban planners, and decision makers) and machine learning processes are customised to answer their requests.
Multi-criteria decision analysis
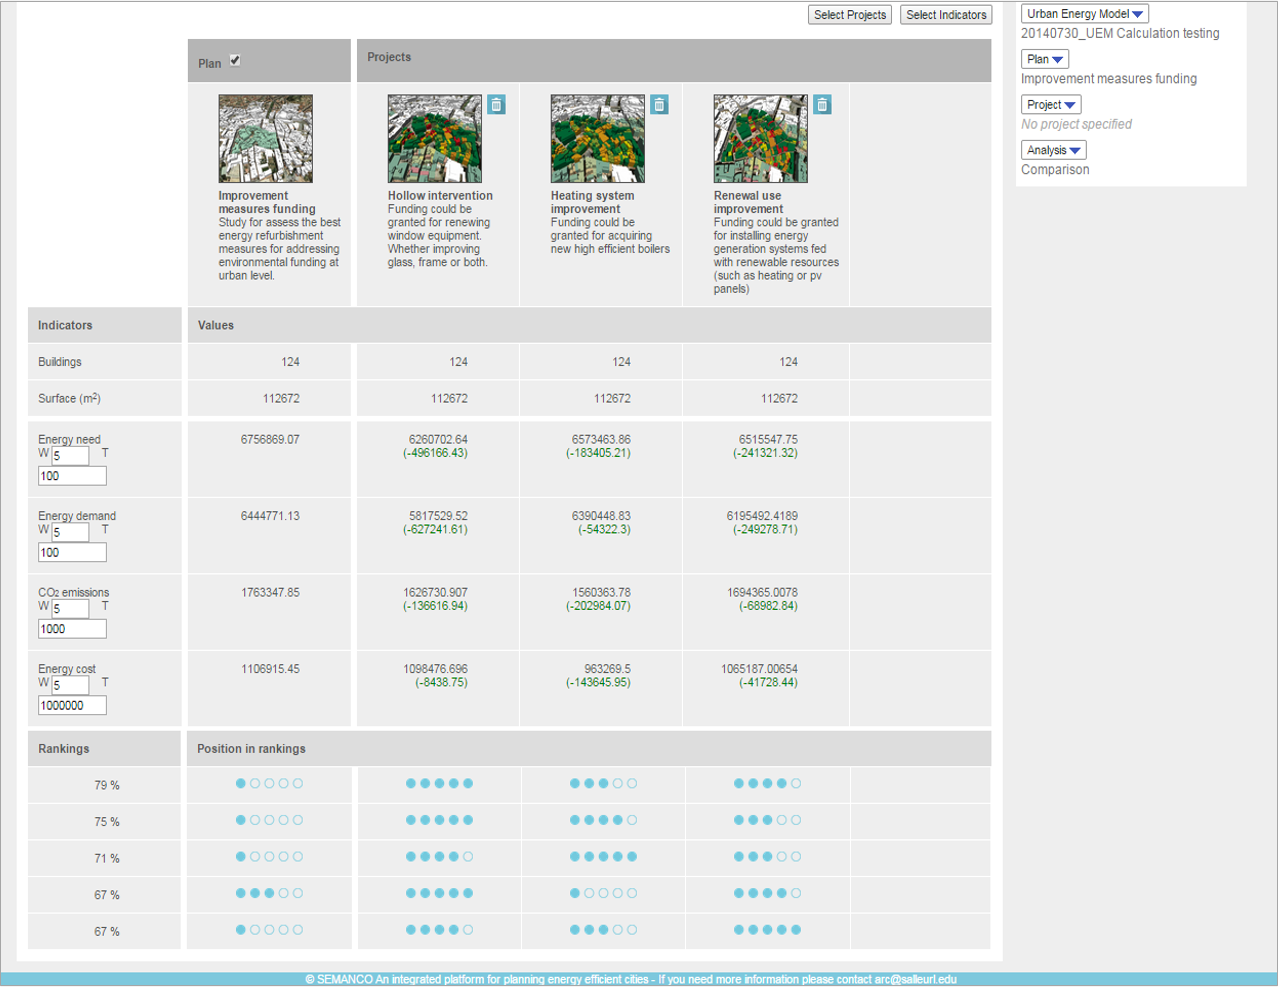
The multi-criteria decision analysis (MCDA) tool supports users to select the best solutions to achieve specific targets by enabling the comparison of multiple plans and projects for a given urban area. The MCDA method is not compensatory, so the weights attached to each evaluation criteria denote its absolute importance when considering the desirability of a given project. This value is independent of both the range of possible values of indicators and of the choice of units used to measure them. The user can introduce indicators beyond those concerned with energy such as the social perception of a particular project.
Data mining analysis

These tools support the decision making process related to energy efficient urban planning. They enable advanced analysis of energy related data at different geographical scales. For instance, at the neighbourhood scale the tools can help to select solutions for building refurbishment and at the municipal scale they can be used to optimise the energy consumption and reduce the CO2 emissions in a newly planned development.
Advanced analysis tools are used for:
- Data retrieval and data classification, performed on the data integrated in an urban energy model. For instance, classifications of buildings according to their usage (family house, apartment block, educational building, shop, storage, garage, etc.), or year of construction; statistics of energy consumption for each building type, forecasts for energy consumption for selected building classes etc.
- Statistical data analysis. For example, using numeric regression algorithms (linear regression) for predicting the energy consumption of a certain class of building.
- Visualising analysis results, in a way that is understandable for the different types of users. Including visualising the results in the 3d model or by means of interactive diagrams and charts.
The data mining is performed with RapidMiner and RapidAnalystics, the data visualization is based on Mondrian and JFreeChart.